Government spending? I don't know what it's all about. I don't know any more about this thing than an economist does, and, God knows, he doesn't know much. -- The Best of Will Rogers
The UK will have a general election in May 2015 and a crucial issue is how the different political parties will approach the economy, so I thought I'd have a close look at what's proposed. But let me be clear on one thing: achieving a strong economy is not an end in itself, but an inseparable part of what we need for a fair and stable society. If we do not understand the existing economic system, or if our understanding is clouded by ideology or populism, then whatever the intention, it is unlikely a just society for the majority will result.
Spending 2008 to 2013
Let's start with the easy bit (or at least easier bit): the amount spent by the UK public sector since 2008 when the recession hit, which is shown in the graph below. The larger of two expenditures shown is the total spent in each financial year, and is called the Total Managed Expenditure (TME). The other figure is the departmental spending, or to give it its official name, the departmental expenditure limit (DEL): it is the portion of TME that was predicted ahead of time and is used to set expenditure of different government departments. First, let's concentrate on TME.
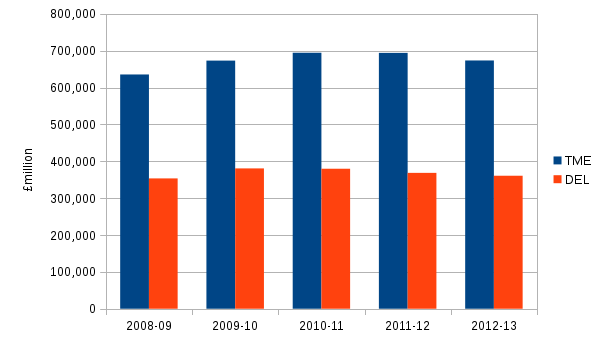
Source: This is the total managed expenditure (TME) and departmental expenditure limit (DEL) published by HM Treasury in their Public Spending Statistics. Note that these data are not corrected for inflation.
At first sight the graph appears rather flat and uninteresting, but to appreciate the change in spending driven by the UK's coalition government, you need account for inflation. Using the official CPI measure to do this produces this graph:
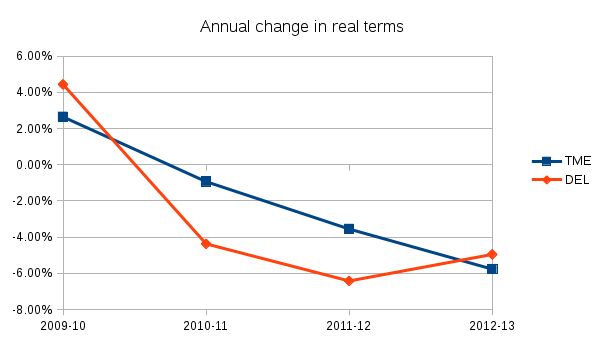
Source: The % annual changes in real terms for TME and DEL shown in the previous graph. Note that these data are corrected for inflation. Each data point shows the change between the financial year shown on the axis and the previous financial year.
This graph shows negative values from 2010-11 onwards, which get several percentage points more negative each year - in other words, cuts in spending. However, notice that the first data point shows expenditure increased during the last two years of the Labour government which departed in May 2010.
Although these figures are corrected for inflation, they do not account for demographic growth, so that, even if spending were frozen in real terms, the fact that the number of people in the UK is increasing, and that people are living longer, means that spending on things such as health and pensions must increase above inflation to keep pace. Recent estimates of demographic growth are about 0.7% per year, and so such spending should at least increase at that rate in real terms to maintain current standards.
Three Expenditure TLAs
Before going further, it's necessary to distinguish between the two components of the Total Managed Expenditure (TME). The first, mentioned above, is the Departmental Expenditure Limit (DEL), and the other one is the Annually Managed Expenditure (AME). The relation between the three is (thankfully) simple enough:
TME = DEL + AME
The DEL is managed over three-year Spending Reviews by the government and it covers aspects of spending that can be more reliably predicted, such as salaries for government employees and running costs for buildings. The AME, as its name suggests, is managed each year and is much less predictable, involving social security, public pensions and other spending not immediately within Central Government control, e,g, that of local councils and also money going to Europe. With all this in mind, it makes some sense that plans for future spending are mainly concerned with the DEL component.
Future spending plans
The spending plans currently being proposed by the main political parties are based on how and when they would reduce the budget deficit to zero, also referred to as a balanced budget. A deficit arises because public sector spending exceeds what comes in from taxes and other revenues. Usually, the government chooses to cover the deficit by borrowing, and this means the public sector debt keeps rising each year. See my previous series of blog posts for more detail on this. The question of whether deficit reduction by cutting spending is a credible economic policy is something I'll leave to the end of this post, for now I want to concentrate on the plans and numerics of what is proposed.
The figures I quote below are all inflation-adjusted, being in 2014-15 prices, and come indirectly from the Office of Budget Responsibility (OBR) and HM Treasury via the Resolution Foundation, which provides more in-depth analysis and detail than I provide here.
The coalition government plan is to have the budget in surplus by 2017-18 - that is, the amount spent will be less than revenues received in the financial year 2017/2018. According to this plan, a reduction in DEL (i.e. a cut, sometimes eupemised as 'consolidation') of £45 billion between now and the end of that year will yield a surplus of £13m.
If Labour form the next government then they have committed to bringing the deficit to zero by the end of the next UK parliament, which will be in 2019/20. To do this will involve a much smaller reduction in DEL of about £7 billion over 4 years. That said, Labour have left themselves quite a bit of flexibility and could take a number of different routes to their end goal. You could interpret this as leaving the door open to making deeper cuts sooner, or equally, as an admission that there are many factors outwith a government's control, including many aspects of the wider economy.
In summary, if the Conservatives form the next UK government we'll see DEL cuts of the order of £15 bn per year, whereas if it's Labour then it's likely to be around £2 bn per year.
Assumptions
I think it's important to take these predictions with a pinch of salt. According to the coalition government's own plans, made at the start of the current parliament, the budget should already be in balance by now. The main reason that it isn't is because the economy did not grow at the rate predicted and, more pertinently, tax receipts, especially income tax receipts, failed to bring in the revenues they expected.
The same failure could well be repeated and render the above predictions invalid if assumptions made about growth and tax receipts are too optimistic. Or, it could be that unexpected growth in the economy means that the budget can be brought into balance by Labour's 2019-20 goal without the need for such deep cuts, or indeed any cuts at all, as Paul Mason pointed out on his blog.
So given the great uncertainty in the assumptions made, I'm not so interested in the absolute numbers that these predictions generate, but rather the difference between the numbers and the implications of how they would impact on our society.
Political comment
I'm very frustrated that we are being offered a choice between austerity and austerity-lite - in other words, a choice between two scales of cuts to public sector spending. Remember too that these cuts will have a much harsher effect on society than those to date because the "easy" savings, especially justifiable efficiency savings, will have been made first. That said, a common fallacy I've heard, mostly in social media and everyday conversation, is that there is no difference between the two big party's plans. To be clear, the Conservative's cuts are at least five times larger than those of Labour's under the above predictions.
In the UK we do of course have more than two parties. The Liberal Democrats also wish to zero the deficit by 2017/18, and propose something between the deep cuts of the Conservatives and the shallow cuts of Labour. Nicola Sturgeon - First Minster of Scotland and leader of the Scottish Nationalist Party - made an interesting speech in London recently. At first I was encouraged by her focus on social justice and welfare, which plays very well to the Scottish electorate at present, and her argument that these require an increase in spending. Except, she then lost me when she joined the other party leaders in saying that the deficit is "hugely important" and so increases should be limited to real terms to 0.5% in departmental spending (and she also confused spending and investment in that part of her speech). This will not keep pace with demographic growth, and as Douglas Fraser pointed out, it is austerity re-badged. The Resource Foundation showed that the difference between SNP and Labour plans are somewhat insignificant; a point also made, albeit in a different way, by Paul Mason. The figure that made the headlines was that the SNP were proposing £180 bn of extra spending, but that was compared to the Conservative's plan. I was left with an image of a person proudly standing tall, but in a five-foot hole in the ground.
But there's another recent historical fact that I touched on earlier that should make you stop and think - during the last two years of the previous Labour government, in the immediate aftermath of the 2008 crash, departmental spending grew at over 4% in real terms. Not only that, but the economy was showing a marked improvement at that time, experiencing five quarters of growth which ended when the coalition government came to power. In addition, as I showed in this post, the deficit post-2008 came about not simply because spending shot up, but because tax and other public sector revenues fell back. All this points to a solution: we reverse what happened in 2008. Public sector revenues will rise if the economy can be improved and that in turn will cause the deficit to drop. How should the economy be improved? The public sector should invest - not just spend - on things that the economy, and more importantly, society, needs, such as houses, transport, clean energy generation and so on. All these things will create jobs which will push wages up in real terms thus creating a demand for goods and services that will boost the economy. The distinction between spending and investment is crucial; the latter will bring you a return in the future.
Why does the public sector need to provide the investment - can't it be left to venture capitalists and businesses? Well, the private sector on its own has not found a way to do this after 7 years of economic doldrums, and despite the repeated claims, the austere act of cutting public spending has hindered rather than helped. Although the UK economy is growing, and employment rising from its low point, both GDP per capita and wages in real terms are still below where they were 7 years ago, and that hurts both private business (lower demand) and the public sector too (lower tax receipts). More importantly, the knock-on effect is to worsen the hardship of the people who already have the least in our society.
My view is therefore that we have trimmed public sector spending as far back as it can go, most likely too far, and we should instead increase public sector investment, even if borrowing is required. The UK public sector can borrow cheaply now and that investment - as the word suggests - will bring returns in future years in the form of a healthier economy and so higher tax receipts, which can balance a budget and even create a surplus if desired.
If you're willing to move further beyond prevailing dogma, then we don't even need to borrow to invest - the UK can, if there's political will, simply create the money. It could do something like quantitative easing, but invest more usefully, rather than just buying back its own bonds. The best proposal we have from mainstream political parties is the SNP's modest 0.5% increase in departmental spending, which is about £1.5 bn a year, and doesn't even keep pace with demographic growth. Comparing this with the severe £15 bn per year Conservative-planned cuts strikes me as a false dichotomy. Instead I'm thinking of the £200 bn that was created and then spent between March and November of 2009, followed by another £175 bn in subsequent years. The £375 bn created for QE is more than one year's worth of DEL, and a twentieth of this amount - yes, 1/20 - equates to a 5% real terms increase in departmental spending which, if you cast your eye back up to the last graph, is about equal to the increase in DEL in the last year of the previous Labour government, and roughly ten times what the SNP propose now.
I can't help thinking there is both a poverty of understanding and of ambition with our politicians, and that this is because they, and others, are too distracted by ideology and party political media battles to realise that their actions, with good intent or otherwise, will do exactly what no politician should ever do - make the poorest in a society poorer.