This is the third post in this series on the UK in recession. This time I'll look at how the deficit (described in my last post) leads to borrowing (PSNB ex) and debt (PSND ex). Unfortunately this means I have to start off with rather dry and possibly boring definitions, but be assured this is so I can enter more interesting territory later. As before, I'll concentrate on the data first and confine all political commentary to the last section.
Full sources are given below, but you can also check the spreadsheet I've constructed to produce all the graphs in this post: download ods or download xls.
Previous posts in this series:
The connected definitions of public sector deficit, net borrowing, net cash requirement and net debt that I discuss below can be seen in the diagram on page 10 of the Public Sector Finances, August 2014 document.
Public Sector Net Borrowing (PSNB ex)
The PSNB ex is the official figure for what the UK public sector borrows in a given time period. (How it is borrowed and why it has to be borrowed will be discussed later.) It is the headline figure published by the ONS and it is the one most often used by both journalists and politicians, even though they still prefer to use the word 'deficit' when discussing it. Remember that the "ex" means that it excludes temporary effects due to bailing out of banks and most aspects of quantitative easing (see the last post's discussion of APF's interest payments).
The PSNB ex for a given time period (usually month, quarter or year) is given by
PSNB ex = Deficit + Net Investment
Investment is the amount spent by the UK public sector on buying capital assets. This is not counted in the expenditure used to calculate the deficit because capital assets continue to be useful in the future. For example, money spent on building a hospital in a given year will create a capital asset that will be used to improve the health of people in subsequent years. In this sense it is an investment in capital, but unlike the usual meaning of that term, the return on this investment is not monetary, but societal. In contrast, paying a nurse to work in a hospital for a given year would come under government expenditure because that money only "buys" the nurse's work in that year. Similarly, the purchase of medicines, bandages and food is all included in expenditure because these items are consumed (quite literally for food!) in a one-off use and not available to be used again.
So the reason investment is treated separately is because the money is not consumed but transformed into an asset. It's possible that a public asset may be sold, and such a sale, or disinvestment, or divestment, would be subtracted from the total, hence "net" investment. You may recall from my last post that in addition to expenditure, a deficit can be increased by depreciation; this accounts for the fact that assets lose value over time.
The graph of PSNBex is shown below along with its split into its deficit and net investment components.
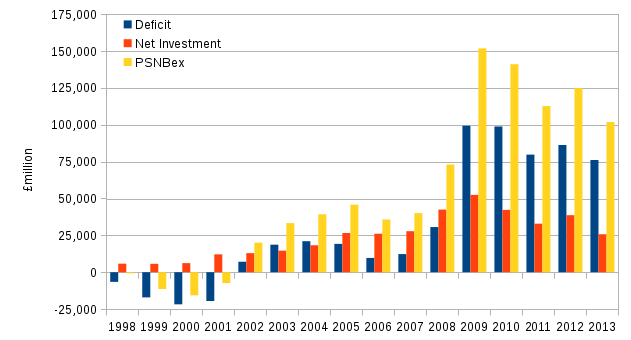
Source: Office of National Statistics (ONS) Public Sector Finances August 2014 release. The data plotted are the labelled -JW2T, -JW2Z, -J5II on the "psa1" tab of the data tables spreadsheet. Note that these data are not corrected for inflation.
Notice that, by definition, if you stacked each blue column (deficit) on the adjacent red column (net investment) it would exactly equal the the yellow column (PSNB ex). Also, before 2008, net investment generally made up the larger share of PSNBex, but thereafter deficit dominated.
Cash vs accrual accounting
If life were simple, Public Sector Net Debt (PSND ex) for a year would be calculated by adding PSNB ex to the previous year's PSND ex. But life isn't so simple and some understanding is needed of basic accounting practices.
In cash accounting the transaction is deemed to take place at the time when the cash was transferred. Consider the example of a company having their windows cleaned on the 1st of October. The cleaning firm does the work and issues an invoice to the company with that date on it. If the company pays the window cleaning invoice on the 30th October, meaning that money left their bank account on that day, then that is the date that will appear in the company's cash accounts. However, if the accounts were done on an accruals basis then the date of the transaction is when the liability came into existence, which would be the invoice date of 1st October.
Public Sector Net Cash Requirement (PSNCR ex)
PSNCR ex is calculated on a cash basis whereas PSNB ex is on an accruals basis. As such, there's no simple formula relating the two, but the differences are caused by two distinct effects:
- timing differences - as described above, the time between when the liability arises and the cash changes hands.
- financial transactions - purchase of an asset does not affect PSNB ex if its value is equal to the amount of money paid for it, but the flow of cash might need to be factored into the PSNCR ex
In both cases, if you look over long enough time periods you'll find these differences are much less pronounced. For example, for the financial year to end of March 2013, PSNB ex was £119.4m and PSNCR ex was £95.5m, but if we add the preceding three years to these figures we find they are £518.8m and £524.3m. (These data can be found on the "psa3" tab of the data tables spreadsheet.)
Public Sector Net Debt PSND ex)
If you take PSND ex at the end of last year and add this year's PSNCR ex then you will get this year's PSND ex. Well, almost. The following effects mean that changes in PSND ex don't just come from adding PSNCR ex:
- variations to do with gilts (UK government bonds) and their value and when changes accrue
- fluctuations in exchange rates that alter the sterling value of liquid assets in PSND ex
- reclassification of bodies into or out of public sector
Taken together these usually amount to no more than a few percent of PSND ex prior to 2008, i.e. most of the difference from year to year does come from simply adding on PSNCR ex. Since 2008 the above three effects have mostly been larger. You can see this is the "psa4" tab of the data tables spreadsheet
The graph below shows the PSNDex (blue) and with PSNCRex (red) stacked on top of it.
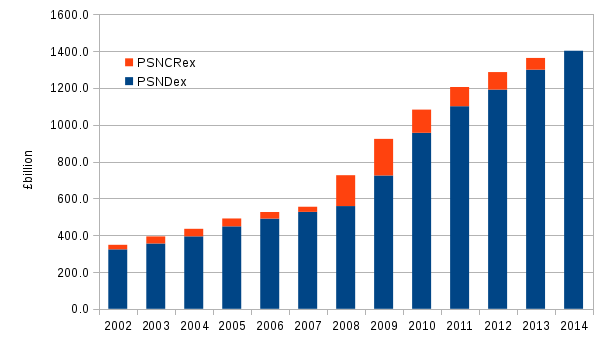
Source: Office of National Statistics (ONS) Public Sector Finances August 2014 release. The data plotted are the "psa3" and "psa4" tabs of the data tables spreadsheet. Each column shows PSND ex for the year to end of March and stacked on top of it is the PSNCR ex for the following year (from April 1st). Note that these data are not corrected for inflation. The PSNCR ex for 2014/15 is of course not known, so there is no red portion for 2014.
The stacked plots lets you see that PSND ex increases by about the PSNCR ex each year. For example, the top of the whole column for 2008 (PSND ex plus PSNCR ex) is at about £700 bn, which is level with the top of the blue column (PSND ex) for 2009. Notice that the top of the whole column for 2013 falls short of the 2014's blue column. In this case there is a £39 bn increase in PSNDex that is not accounted for by PSNCR ex. Looking at the row for 2013/14 in the "pas8d_1" tab, it's clear that there is a high entry in the column labelled "Bank of England contribution to PSND". The footnote indicates that most of this is due to APF, i.e. buying of gilts, but I'm not clear why this amount effects the PSND ex but not PSNCR ex.
How is the borrowing done?
Most of UK public sector borrowing - £1300 bn at time of writing (tab "ps8a", column labelled BKPM) - is in the form of gilts, which are UK government bonds. Rather than going to a bank, as you or I might do, and asking for a single big loan, the UK public sector carves its debt up into small chunks, called government bonds. Each bond can be bought for £100 and represents that amount of debt. When you buy a bond, you become the owner of £100 of public sector debt and in return for this you will receive a fixed payment twice each year (called the coupon for a UK gilt) and after a specified number of years the bond expires and you'll get your £100 back.
New gilts are issued by the UK Debt Management Office (DMO) on a regular basis and are usually bought by pension funds, investment companies, private banks and even by members of the public. You can buy gilts in the open market but you will find that the price is not necessarily £100. The amount you pay for a gilt will determine its yield. For example, if you buy a bond direct from the DMO for £100 with a stated return of 2% then you will receive £2 per year, and the yield will be the same, i.e. 2%. However if you bought that gilt in the open market later on for, say, £200, then you would still only receive £2 per year for it, and so the yield would be £2 out of £200, or 1%. In other words, if the price of gilts goes up, the yield goes down, and vice versa.
So, if the UK public sector wishes to increase its debt it issues more bonds, and if it wishes to reduce its debts, it simply has to let existing bonds expire and not issue new ones. The UK has never defaulted on its debts and for that reason (and because a state with its own currency can't go bust, of which, more in the next post) gilts are seen as one of the safest and lowest risk of all investments. There is no shortage of people or firms that wish to buy UK gilts, and pension funds in particular own a significant number of them.
Why does the UK public sector borrow?
You may know, possibly from reading my previous post, that Quantitative Easing (QE) is the process of creating money to buy government bonds. In the UK, the Bank of England has been creating money and lending it at a low interest rate to its wholly owned subsidiary, the Asset Purchase Facility (or APF), which then uses it to buy gilts. To date, £375 billion has been created and spent doing this, and as a result 30% of UK public sector debt is currently owned by the APF, which is owned by the Bank of England, which is part of the UK public sector. In short, the UK public sector owes itself about £375 bn of its own debt.
Why, you may ask, doesn't the UK public sector just write-off this debt? After all, it's silly to owe yourself money. The answer is that it cannot do so without violating the Maastricht Treaty by which the European Union was established. In short, countries in the EU are forbidden from creating money to fund spending or pay off their own debts. QE is permissible, as long as the gilts are purchased in a particular way, hence the APF and the low interest "loan" from the Bank of England, and there is an intention to sell the gilts back into the market at some point.
Political comment
I'm pretty sure the detailed cash-flow of the UK public sector shows that created money plays a significant role in government spendinng: in fact, QE is just a big and obvious example of that. By this I mean that the UK public sector does not need to wait for money to come in from tax, other income or borrowing before it can spend. It can spend first, and reconcile its accounts in retrospect, as long as it does so according to the rules set out in the Maastricht Treaty.
Political statements often make it sounds like the UK public sector, and particularly the government, needs to balance its books in the same way as a household. But it should be clear from all that's said above, and the wealth of evidence contained in the ONS's Public Sector Finance spreadsheets, that the UK public sector is fundamentally different from a household. For starters, there is absolutely no equivalent of QE in a household. Furthermore, a household with a zero bank balance cannot spend money without first securing a loan, credit agreement or some kind of overdraft with a bank or other lender. The UK public sector has much more freedom and is limited only by its voluntary agreement to the Maastricht Treaty.
This leads to the interesting question of why the Maastricht Treaty places such restrictions on EU states? The simplest response is that money creation, or to be more pejorative, printing money, has very negative connotations, such as the hyper-inflation in Germany after the first world war. But QE in the years after 2008 created hundreds of billions of pounds and this money is still in the economy, yet inflation is currently hovering around 1%, which is not only historically low, but also worryingly low. My next blog post - the final one in this series - will look at why many of the doom-laden predictions of QE's money creation turned out to be completely false, and what implications that has for promoting economic recovery.