This is the second post in the series. I'll pick up where I left of at the end of the last post and investigate the deficit and how it relates to public sector spending and income in the time period of interest, from 1997 to 2014. As before, I'll concentrate on the data first and confine all political commentary to the last section.
Full sources are given below, but you can also check the spreadsheet I've constructed to produce all the graphs in this post: download ods or download xls.
Previous posts in this series:
Deficit
The UK public sector spends money on goods, services, paying staff (including civil servants, doctors, nurses, teachers etc), paying state pensions and welfare, paying interest on its debt and many other things besides. The public sector receives income from VAT, income tax, corporation tax and interest payments and dividends, amongst other things. If what the public sector spends - its expenditure - is larger than its income - its receipts - then there is a budget deficit. Conversely, if receipts exceed expenditure there is a budget surplus. Confusingly, the budget surplus/deficit is sometimes referred to as just "the current budget" or "the budget value". A more recent term being used in Europe is SOCB - Surplus On Current Budget - which will be a negative value for a deficit.
The deficit is calculated as
Deficit = Expenditure + Depreciation - Receipts
as defined on page 10 of the Public Sector Finances, August 2014 document.
Here is the graph of the deficit and its three components.
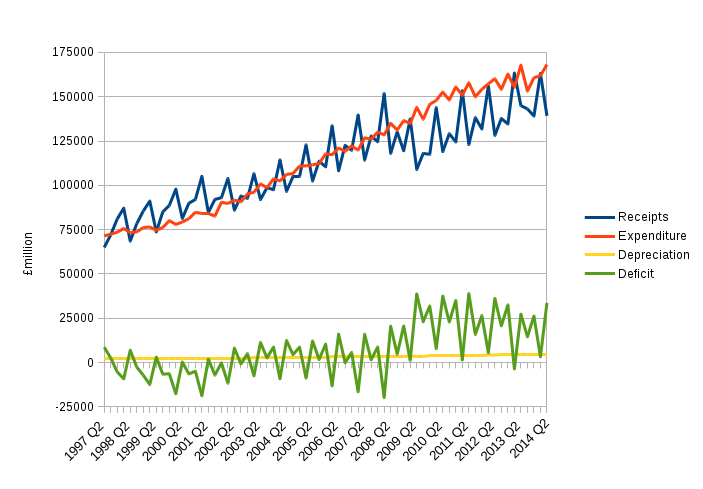
Source: Office of National Statistics (ONS) Public Sector Finances August 2014 release. The data plotted are the receipts total labelled ANBV on the "psa6b_1" tab of the data tables spreadsheet. The Expenditure, Depreciation, Deficit are labelled as ANLP, NSRN, ANLV on the "psa6b_2" tab. Note that these data are not corrected for inflation. The depreciation is clearly a relatively small and slowly varying so we needn't concern ourselves with it.
What's almost immediately obvious from this graph is that the expenditure follows much the same increasing trend from 1997 to 2014, even through the recession itself. The increased deficit post-2008 is caused by the drop in receipts. In other words, government spending did not cause the deficit to grow; it was caused by a drop in income.
One problem with looking at these graphs is that there are strong quarter-to-quarter variations. These are mainly from receipts, and in particular from timings of when corporation tax is paid. To avoid being distracted by these details it's better to look at the annual graphs:
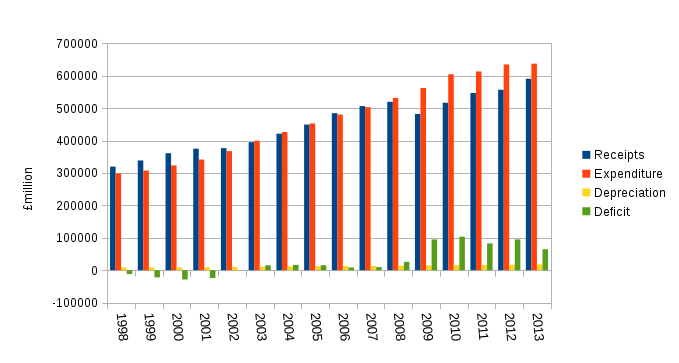
We can clearly see that receipts dropped well below expenditure from 2009 onwards and that expenditure increased every year, although only slightly between 2012 and 2013. It's also apparent that the reduced deficit in 2013 is mostly explained by receipts rising. To understand why, it's instructive to break the receipts down into three groups "Taxes on production", which includes VAT and corporation tax; "Taxes on income and wealth", which includes income tax and capital gains tax; and "Other income", which includes National Insurance Contributions (NICs), interest received and dividends due on publicly owned assets.
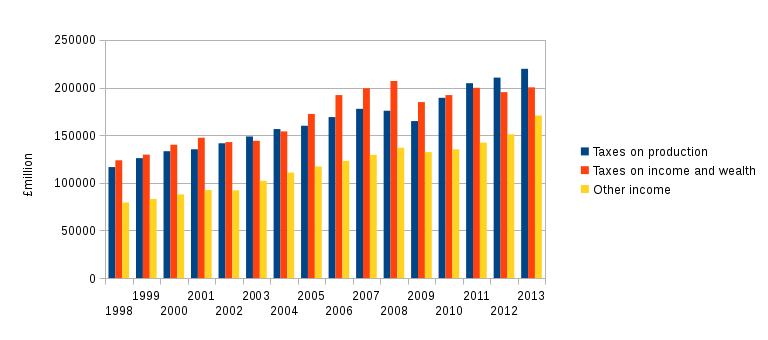
Source: Office of National Statistics (ONS) Public Sector Finances August 2014 release. The data plotted are all on the "psa6b_1" tab of the data tables spreadsheet. The "Taxes on production" data are labelled NMBY; the "Taxes on income and wealth" data are labelled NMCU and "Other income" is the sum of columns labelled LIQR, AIIH, LIQP, LIQQ. All three of these groups of data total to give "Total receipts" labelled ANBV, as plotted in previous graphs. Note that "Asset Purchase Facility" which is given in the column labelled L6BD is included via the LIQP "Interest and dividends" column. These data are not corrected for inflation.
We can see from this graph that receipts fell in all three groups between 2008 and 2009, but particularly taxes from production, income and wealth. This can be plausibly explained by the immediate effects of the recession. Unemployment rose, which meant less from income tax and NICs; consumers spent less, so VAT income decreased; and depressed spending throughout the economy meant companies made lower profits which resulted in lower corporation tax income.
From 2009 onwards we can see the recovery is most evident in the "Taxes on production", but weaker in terms of "Taxes on income and wealth", which has hardly changed between 2011 and 2013. It's worth noting that the increase in Receipts from 2012 to 2013 is mostly due to "Other income" which jumped up by about £20 billion from 2012 to 2013 - roughly the same increase as over the previous four years combined. Most of the this increase was due to £18.6 billion of income that appears for 2013 under a column called "Asset Purchase Facility" (APF) - see spreadsheet tab psa6b_1 column labelled L6BD. This was zero for all previous years, and is worth a bit of discussion.
Self interest, Quantitative Easing and the APF
From March 2009, the Bank of England has been creating money and using it to buy gilts, which are UK government bonds, i.e. shares in UK public sector debt. This process is known as Quantitative Easing (QE). The result of this is that as of 2014Q2 the Bank of England, or rather its wholly owned subsidiary, the Bank of England Asset Facility Fund (BEAPFF or APF for short), has spent £375 billion buying UK public sector debt (see spreadsheet tab psa9 column labelled MDE2). And, since the Bank of England is part of the UK pubic sector, it is correct to say that the UK public sector now owns about £326 billion of UK public sector debt (see spreadsheet tab psa9 column labelled MEX2).
This is clearly a bizarre situation. But it gets more bizarre. In return for holding gilts, the UK government (specifically HM Treasury) will pay interest (often referred to as coupons). This means that the Bank of England's APF has received tens of billions of pounds of payments. The intention is that one day, QE will be reversed and the gilts will be sold, and for that reason they are not counted as an asset of the UK public sector, but a temporary effect of dealing with the recession. If they were counted as assets, we would have to lower the UK public sector debt by about £326 billion, but this is expressly forbidden by the Maastricht Treaty because it amounts to the UK paying off its debt by creating money (see Bank of England Handbook 5). Until 2013, it was also true that the interest payments on these gilts that the APF received were excluded from the Public Sector Finance reports from the ONS. However, it was decided that the interest payments were a permanent effect of QE, and so the APF started transferring interest payments it accumulated to HM Treasury. So from 2013 onwards this flow of money was included in deficit and Public Sector Net Borrowing (PSNB ex) figures from the ONS.
That said, it seems that not all of the payments were included, and that the actual total transferred from the APF to HM Treasury in 2013 was around £40 billion - see spreadsheet tab psa9 column labelled MT6A). The existence of a limit of cash transfers included in PSNB ex is mentioned in this ONS document, but not the reason for such a limit.
The result of including the transfer caused by the build up of gilt interest payments boosted UK public sector income by £18.6 billion, which in turn decreased the deficit by this same amount. This means that about 60% of the £30 billion deficit reduction, from £94.9 billion in 2012 to £64.5 billion in 2013, was due to the new accounting for these interest payments. In other words, more than half of the deficit reduction was not due to spending cuts, nor was it due to a rise in income because the economy had recovered and generated tax receipts.
Deficit, Borrowing and Debt
These days the headline figures published by the ONS are not for the deficit, but for Public Sector Net Borrowing, specifically PSNB ex, and it's those figures that are most often quoted in media reports. I'll explore the relationship between the deficit and PSNB ex and PSND ex (i.e. debt) in my next post and tackle an important question I touched on above when discussing QE: why does the UK government borrow to cover the deficit when it can just create the money?
Political comment
It is astonishing that the UK public sector holds around 30% of its own debt, and that the interest it pays itself for doing so can have such a large impact on the budget - responsible for 60% of the deficit reduction in 2013. But, to me at least, the rationale is sound for reclassifying the monies accumulated from gilt interest payments in this way. It's reasonable to ask why they weren't included in Public Sector Finance reporting from the outset of QE. The answer is that no one expected that as much as £375 billion would be spent on buying gilts, and so the interest payments were not expected to be so significant. When it became clear that they were significant, it was correct for the ONS to include them. I'd therefore say that this is not an example of political trickery, but a case of accounting conventions that became awkward and in need of revision due to unusual economic circumstances.
However, any claim that's made by the current coalition government that it's reducing the deficit should be viewed with profound scepticism. Furthermore, the reason that expenditure continued to climb through the recession is that there was no sensible way to cut it. In fact there were quite legitimate reasons for it increasing: as unemployment rose, the number of people entitled to state benefits rose too. This was not due to shirkers or benefit cheats, as has sometimes been portrayed, but because around 900,000 people who had been working and contributing to the growing economy became unemployed during the first year of the recession. Likewise, health spending could not be cut without hurting those in need.
As you can see from the graphs above, the austerity in the form of spending cuts planned by the coalition government have done no more than to slow the growth in expenditure. and most of the claimed deficit reduction has come from a distracting accounting reclassification. I'm not going to get into the arguments for a government spending its way out of recession in this blog post, and nothing in this blog post depends on such an argument (though I have written about that point before). For now, I'll just point out that the coalition government has not even been able to meet its own targets of reducing the deficit.
Let me conclude by letting Prime Minister David Cameron's words speak for themselves. In January 2013, he said the government was "paying down Britain's debts". At no point has the debt decreased under the coalition government, and so either he was deliberately trying to mislead the public, or he does not understand the difference between 'debt' and 'deficit'. That may be an understandable mistake for an ordinary person, but it's nothing but shocking from the Prime Minister.