This is the third post about GERS 2013-14 (Government Expenditure & Revenue Scotland). Having reviewed revenue and expenditure in previous posts I'm now going to look at how these come together to give a budget balance. You can read about the background to GERS here and find links to download the PDF and spreadsheet of data.
Previous posts in this series:
Balancing acts
First, let's set out some terminology. Talking about public sector budget balances involves many terms that have closely related or identical meanings. For example, "balance", "budget balance" and "budget surplus" all mean the result of subtracting expenditure from revenue. As this is often negative for a country with its own currency, it is more usual to hear talk of the "deficit" or "budget deficit" - the expenditure minus revenue, i.e.the negative of the budget balance.
There are two budget balances given in GERS, but I'll focus on the "net fiscal balance". This is the public sector revenue minus the total public expenditure. The other balance is the "current budget balance". This is public sector revenue minus current expenditure. As described in my last post, total expenditure is the sum of current and capital expenditure, and the capital expenditure differs from current expenditure in that it is used either to purchase or create an asset that will continue to have value or use in the future.
Net Fiscal Balance
The graph below shows the net fiscal balances for the UK and Scotland.
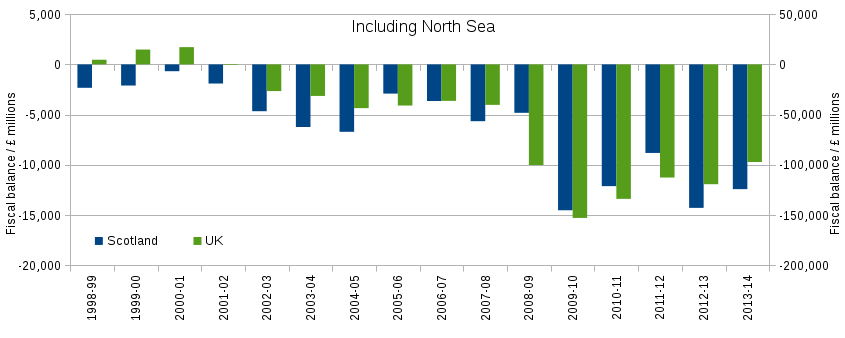
Source: Constructed from Table E.6 in the GERS spreadsheet. Scotland figures include a geographical share (83.8%) of North Sea revenue.
Notice that the values are all negative since 2003, which means that both Scotland and the UK have had deficits, i.e. expenditure has exceeded revenue. The jump in deficit caused by the 2008 crash is in part because expenditure rose, but mostly because tax revenues fell back - I discussed this in more detail for the UK in a previous blog post.
This graph shows the balances with North Sea revenue excluded for both the UK and Scotland. The scales in this graph are identical to the previous one.
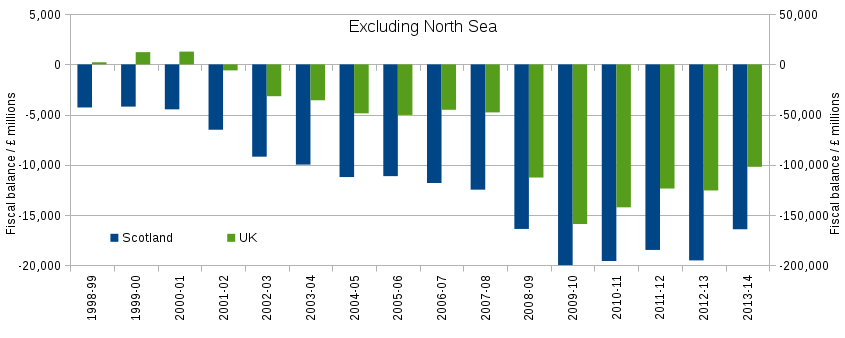
Source: Constructed from Table E.6 in the GERS spreadsheet with data from Tables 3.3 and 5.6..
If you compare this graph with the one above, you'll notice that excluding the North Sea revenue makes very little difference to the UK's green bars, but significantly lengthens Scotland's blue bars downwards, i.e. Scotland's deficit increases dramatically if North Sea revenue is excluded.
The graph below draws on the same data but shows Scotland's deficit as a fraction of the UK's deficit. The first four years are omitted because the UK didn't have a deficit then.
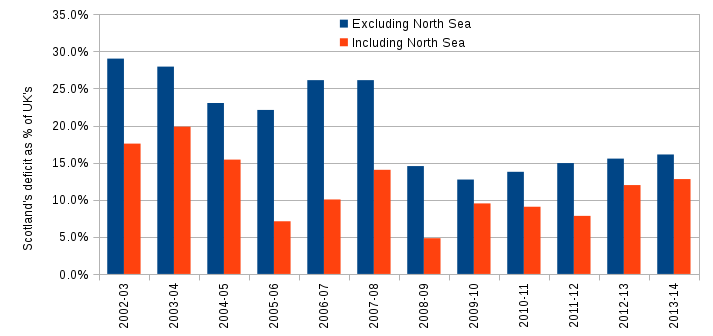
Source: Constructed from Table E.6 in the GERS spreadsheet with data from Tables 3.3 and 5.6..
Look first at the red bars on this graph and bear in mind that Scotland's population share has steadily declined from 8.7% to 8.3% over the years shown. Scotland's share of the deficit exceeds its population share for nine out of the twelve years shown. This is mainly because expenditure per head in Scotland is greater than expenditure per head in the UK as a whole. As we'll see below, the three years in which Scotland did better are the three highest years of North Sea revenue (2005-06, 2008-09, 2011-12).
The blue bars, which exclude North Sea revenue, show a much higher deficit share which is in excess of the population share for all years. It averages about 25% of the UK's deficit prior to the crash in 2008, and at about 15% since then.
North sea revenue
North Sea revenue is sensitive to the oil price which is volatile because it is subject to market forces and decisions made by international oil cartels. The graph below shows UK North Sea revenue and the oil price per barrel:
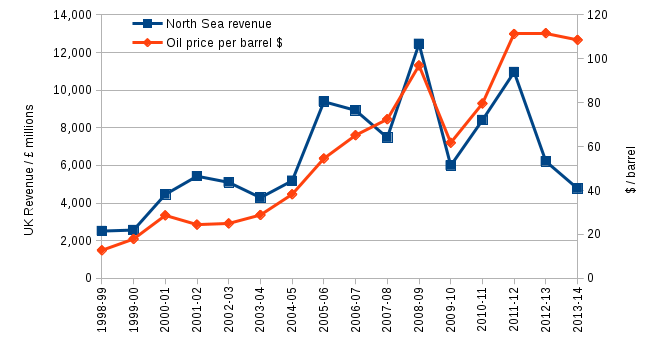
Source: Constructed from Table 3.3 in the GERS spreadsheet with data from Tables 3.3 and 5.6. and the oil price is the Europe Brent Spot Price
The correlation between North Sea tax revenue and the oil price is clear. For instance, both peak together in 2008-09. However, there are departures from the correlation for several reasons related to the fact that the revenue is a tax on profits of companies operating in the North Sea.
Firstly, firms may claim tax breaks for investing in their North Sea infrastructure, or engaging in activities that may benefit future production. Secondly, the money made by oil firms depends on the amount they extract, and if that output changes, so will their profits, even for a fixed oil price. Finally, if operational costs go up, then profits will go down and so will the tax revenue.
From 2011-12 onwards, all of these factors have worked together to reduce the tax revenue from the North Sea despite the oil price remaining high. Operating costs went up and oil firms chose to invest and production declined slightly. Future years of North Sea tax revenue are expected to be lower still because since 2013-14 the oil price has halved. The Office of Budget Responsibility predict North Sea revenues will fall from their recent peak at over £10bn in 2011-12 to be only £0.7bn in 2015-16.
North Sea extra deficit
As we saw above, excluding North Sea revenues for Scotland has a much more significant effect on Scotland's deficit than on the UK's. Let's estimate the extra Scottish deficit that would have resulted if the drop in North Sea revenues had occurred over the five financial years to 2013-14.
For those five years, Scotland's deficit including a geographic share of North Sea revenues averages to £12.4bn. Without North Sea revenues it is £18.9bn. So if North Sea revenues were £0.7bn each year, then Scotland's deficit would have averaged to £18.2bn. So the annual North Sea extra deficit can be estimated as £18.2bn - £12.4bn = £5.8bn.
Bottom line
In 2013-14, and for the twelfth year in succession, both Scotland and the UK ran a budget deficit. In nine of those years Scotland's share of the UK deficit was greater than its population share, and in the other three Scotland benefited from unusually high North Sea tax receipts.
Typically, 10% to 20% of Scotland's annual revenue has come from North Sea tax receipts. However, from a high of over £12bn they have fallen to £4.7bn in 2013-14 and are predicted to fall to £0.7bn in 2015-16 and remain at this level for the foreseeable future. If this had happened in the last five years then Scotland's deficit would have been raised by £5.8bn. The Institute for Fiscal Studies (IFS) predict that this figure will be £7.6bn for 2015-16.
It's important to realise that the predicted £7.6bn is additional to the existing deficit. Scotland's total deficit would be roughly £15bn according to the above figures; this is larger than Scotland's annual expenditure on the NHS. Scotland's share of the UK deficit will rise into the 15-20% range in future years, so likely more than twice Scotland's population share.
Scotland's deficit is notional at present because of the way that revenues are pooled across the UK, and so does not impact expenditure in Scotland. If Scotland had voted to become independent, or opts for Full Fiscal Autonomy (FFA) in coming years, then the pooling would end and this notional deficit would become a reality.
It is true that these figures represent only a starting point for what would happen under FFA, and the powers of FFA would allow Scotland to make choices to promote growth and borrow to cover its deficit. That said, it is inarguable this starting point presents a fully fiscally autonomous Scotland with an immediate and very serious challenge.
My next post will be the last in the series on GERS 2013-14 and will describe my views on the wider political implications for Scotland and the UK.