I've written a number of blog posts about the UK public sector finances and have been wanting to give similar scrutiny to the Scottish equivalents but was holding off until GERS (Government Expenditure & Revenue Scotland) for 2013-14 was published. It was released on Wednesday 11 March 2015 and I've spent some time reading through its 98 pages. You can about the background to GERS here and find links to download the PDF and spreadsheet of data.
Note that GERS is consistent with the ONS UK Public Sector Finances (PSF) January 2015, whereas my previous blog posts are based on PSF data published in Sept 2014.
The first few blog posts will concentrate on data and facts and - as far as I can manage it - I'll keep political comment confined to the last post in the series. My aim is to make GERS more accessible and highlight points that have interested me, and will hopefully interest you too, especially where such points haven't come up in GERS coverage elsewhere.
Whilst writing this post, I came across this thoughtful and clear analysis of GERS by Kevin Hague. I recommend you read it. He takes a different approach to me in some ways (e.g. looking at rUK figures), but it's valuable to have different views on the same data. Perhaps you, dear reader, might consider writing something too? Apart from sharing your thoughts with others, and perhaps spotting something no one else has noticed, you'll find there is no better way to ensure you understand something than explaining it in words.
General points
Scotland's GERS differs from the UK's Public Sector Finances (PSF) in that it has to allocate shares of certain tax revenue to Scotland. This is most crucial for North Sea revenue. GERS offers two alternatives: one is the population share, and the other, which I'll mean unless otherwise stated, is the much larger geographic share.
I'll probably come back to the North Sea in a later blog post, but for now keep in mind that 2013-14 represents a very poor year for North Sea tax revenues and that the recent crash in oil prices occurred after this time period - i.e. next year is likely to show even lower North Sea revenue.
Scotland has 8.3% of the UK population and many of the percentages from GERS are within a few percentage points (pp) of this. It's the minority that aren't that are particuarly interesting as they highlight aspects of public finances that are unique to Scotland.
On a technical but important note, all figures here and in GERS are quoted are in current prices, also known as nominal values, i.e. they are not corrected for inflation.
Revenue history
The following graph shows the revenue of Scotland as a percentage of the UK total, and, for reference, the percentage of the UK population in Scotland.
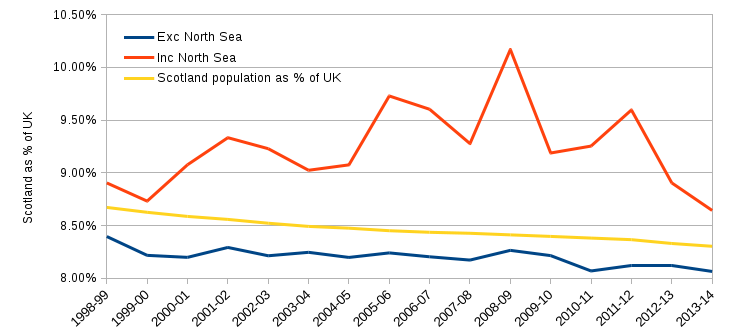
Source: Table 3.1 of GERS spreadsheet.
The revenue including that from the North Sea (red) is always above Scotland's population share (yellow). This is because the North Sea share is allocated geographically. In 2013-14 the population share was 8.3% but the geographic share was 83.8%.
The revenue share excluding the North Sea from both Scotland and the UK (blue) is noticeably less volatile and is always below the population share (yellow). The declining trend is simply mirroring the decline in population share; Scotland's population is growing more slowly than the UK's.
Revenue breakdown
The top 12 sources of Scotland's public sector revenue are shown in the bar chart below. These come to a total of £50.4 bn or 93% of Scotland's total revenue. North Sea revenue is shown in two colours: blue is the population share, and the blue+green is the geographic share.
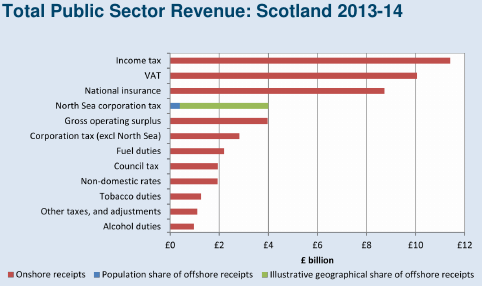
Source: Page 34 of the GERS 2013-14 report or Table 3.1 in the accompanying spreadsheet.
Income tax, VAT and national insurance are the top three sources of revenue. Table 3.1 in GERS shows that these are the top three for the UK too.
The fourth largest income for Scotland in this year was North Sea corporation tax revenue at £4.0 bn. Remember though, this is a bad year for North Sea revenue. In a good year, such as 2011/12, this figure was closer to £10 bn, similar to Scotland's VAT revenue. For comparison, North Sea corporation tax revenue for the whole UK is £4.8 bn and ranks fifteenth amongst its revenues.
Next up, and only a shade smaller than the North Sea revenue, is the enigmatic sounding Gross operating surplus. It is explained on page 37 of GERS as being money received from public sector corporations. (You could call it public sector profit without troubling a semantic pedant too much.) This includes Scotland's share from UK-wide bodies, such as from The Bank of England, but a significant portion of it is for Scottish Water, of which, more later.
Scotland's share
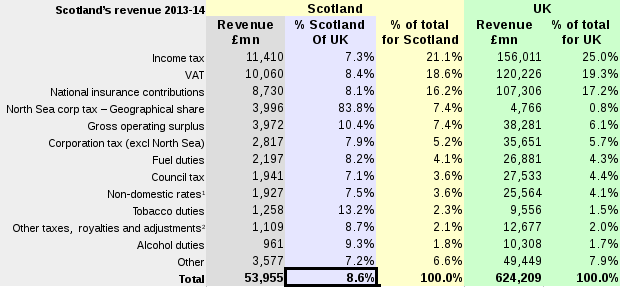
Let's start by looking at the purple column of the table below which shows Scotland's revenue from each source as a percentage of the UK's.
The percentages are generally within a percentage point (pp) or two of the 8.3% population share. Of the top 12 sources of revenue in the table, seven are within 1pp of 8.3%, and nine are within 2pp.
By far the biggest departure - by a factor of 10 - is the 83.8% geographic share of the North Sea revenue. The next biggest is for Tobacco duties, for which Scotland contributes 13.2% of the UK's total, followed by the above-mentioned Gross operating surplus at 10.4%.
Whilst VAT and national insurance are unremarkable, coming in at 8.4% and 8.1% respectively, income tax is somewhat low at 7.3%, reflecting that individual incomes in Scotland are below the UK average.
Source: Top 12 revenues for Scotland from Table 3.1 in the GERS spreadsheet.
Shares of totals
The yellow column shows the revenue from each source as a percentage of the Scottish total in 2013-14. The last green column does the same for the UK. These data give us an alternative view of how Scotland differs from the UK as a whole.
Income tax makes up 21.1% of Scotland's revenue, whereas it is 25.0% of the UK's. Again this tells us that average incomes received by individuals is lower in Scotland. This is the main reason why revenues excluding the North Sea in the above graph (blue) are below Scotland's population share (yellow).
National insurance (NI) shows this too but to a smaller extent. Since NI doesn't ramp up with income (income tax goes up from the 20% basic rate to 45% for the highest incomes), this suggests that there is a class of very high earners outside Scotland that pull the UK average up.
VAT percentages are not too different and the share in the purple column is only 1pp from 8.3%. This suggests that Scottish consumers are little different in their overall spending from the UK as a whole. I might venture a guess that this is because the higher earners outside Scotland (mentioned above for NI) are saving or investing their extra income rather than spending it.
There's little else of note in the yellow and green columns, except, of course, for the North Sea corporation tax revenue. This revenue is 7.4% of Scotland's total for 2013-14, but only 0.8% of the UK's total. Remember this is for a bad North Sea year; for a good year such as 2011/12 it was 17.0% and it reached an all time high of 20.6% in 2008/9. For comparison, the share of non-North Sea corporation tax in 2013-14 was 5.2%. So, even for a bad year, Scotland's corporation tax revenue from the North Sea exceeds that for all other business activities.
Scottish Water and public ownership
Those who think that the private sector companies are necessarily more efficient and profitable than public sector ones may be surprised by the statement on p24 of GERS that "UK public corporations ... tend to run at a slight surplus". This is clearly backed by the evidence in GERS and in the UK Public Sector Finances (PSF).
Water and sewerage services in Scotland are provided by public sector owned Scottish Water, but in the rest of the UK they are mostly provided by private companies. Thanks to the surplus generated by Scottish Water, Scotland's Gross operating surplus is 10.4% of the UK's total revenue.
Scottish Water also shows up as extra expenditure peculiar to Scotland too, which I'll describe in the next blog post. (As an aside, I recently had an interesting chat with Scottish Water's Chief Operating Officer about its history of public sector ownership, but that's also for another blog post.)
Devolution
It's clear from the above that Scotland's revenues as a percentage of the UK from each source are mostly not too different from its population share of 8.3%.
The most obvious exception is the 83.8% geographic share of North Sea revenues, but remember this is just an illustrative figure and not one that has any tangible meaning in the running of the UK or Scottish public sector.
Most of the remaining differences are of a few percentage points or less, and are caused by socioeconomic factors rather than because Holyrood has exercised devolved powers. For example, consider income tax: it is the largest revenue source, and Scotland brings in 7.3% of the UK's income tax, and is 1pp below Scotland's population share. This is because average incomes are lower in Scotland, and not because the basic rate of tax is different; Holyrood has never used its power to vary income tax.
One area where Holyrood has exercised its devolved powers is to freeze council tax. It now sits well below the 8.3% population share at 7.1% of the UK total. This doesn't necessarily mean that Scottish councils have experienced a commensurate drop in revenue, because the Scottish Government can choose to provide top-up funding. However, it does mean that some revenue raising powers have been removed from local councils and centralised in the Scottish Government.
Bottom line
Scotland's revenue, including the North Sea, as a percentage of the UK's was 8.6% in 2013-14. Excluding the North Sea, this percentage drops below the population share of 8.3% to 8.1%.
The more popular way to express this is using the figures in GERS table E.2. The revenue per person in Scotland is £400 higher than for the UK if North Sea revenue is included, but £300 lower if excluded.
Of course, this is only one part of the story. The next blog post will be concerned with expenditure.