This is my second post about GERS 2013-14 (Government Expenditure & Revenue Scotland) and I'm going to turn my attention to Scottish public sector expenditure. You can read about the background to GERS here and find links to download the PDF and spreadsheet of data.
Previous posts in this series:
As with the last post, it's important to remember that Scotland's share of the UK population is 8.3% as this provides a good benchmark for judging how expenditure differs in Scotland from the whole of the UK.
Expenditure history
This graph shows the history of public sector expenditure in Scotland and the UK.
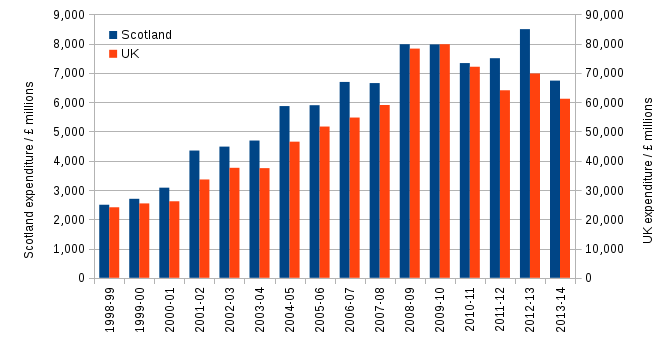
Notice that the UK scale (right) is ten times the Scotland scale (left) and that every blue bar is higher or level with its partner red bar. This means that in all years the percentage of UK expenditure in Scotland is at least 10%, and so larger than Scotland's population share which has declined from 8.7% to 8.3% over the years shown.
Expenditure for both the UK and Scotland steadily increased from 1998, then jumped up in 2008-09 at the start of the Great Recession, and decreased from 2010 onwards due to coalition government cuts, though less markedly for Scotland.
Capital vs current expenditure
Current expenditure makes up around 90% of the totals shown in the above graph. It is money that's spent in a one-off way, such as buying food for hospitals - it's consumed once (hopefully!) and then it's gone. Paying staff such as doctors, nurses or teachers also comes under current expenditure.
Capital expenditure is where money is spent on creating an asset which gives repeated use or value in the future, such as in building a hospital. The cuts since 2010 have been heavier on capital spending in both Scotland and the UK, presumably because it is is easier not to build a new school or hospital than to cut the pay of people that staff them. There are of course serious long term consequences of cutting capital expenditure. Beyond this, I found nothing particularly noteworthy in the division of current and capital expenditure in GERS.
Expenditure breakdown
This pie chart shows the areas of expenditure in Scotland that exceeded £2bn in 2013-14 with the remaining 15% of expenditure lumped into the Other slice.
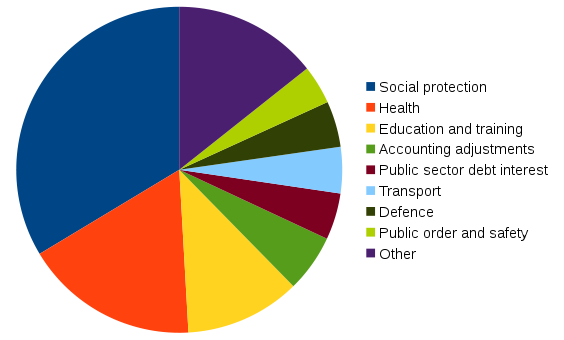
Much of the largest slice, Social protection, goes to paying state pensions with the remainder being made up of things such as housing benefit and income support. The yellow and green columns show that Social protection increased as a percentage of total revenue for both Scotland the UK, which is a result of the jump in unemployment triggered by the Great Recession of 2008.
The next largest is Health which combined with Social protection comes to about half of all expenditure. Education and training is third largest, which I'll come back to shortly.
The appearance of Accounting adjustments in fourth place at £3.8bn caused my eyebrows to raise, but it is explained in appendix B of GERS as reconciling the difference between expenditure figures from HM Treasury which are used for Scotland, and the UK equivalents from the Office of National Statistics (For the detail-hawks, it's mainly the difference between Total Managed Expenditure TME and Total Expenditure on Services TES.) The adjustment also involves another, much smaller correction to account of EU transactions.
Scotland's share
The table below gives more detail about expenditure for 2013-14 ranked so that the largest areas are at the top.
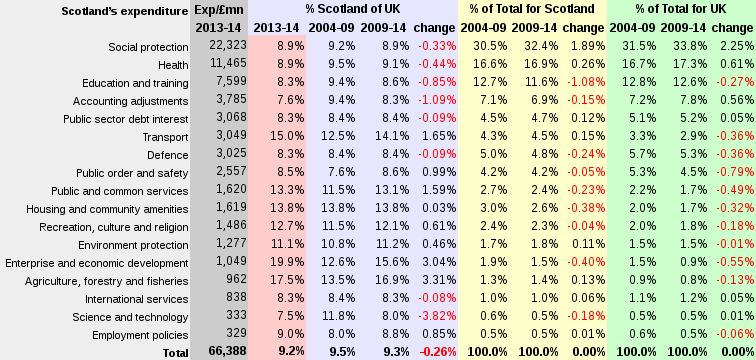
Source: Constructed from Table 5.5 and 5.6 in the GERS spreadsheet. The ranges cover five financial years, i.e. 2009-2014 is the sum over all years from 2009/10 to 2013/14.
There's a lot to take in, but first focus your attention on the pink column which shows Scotland's expenditure for 2013-14 as a percentage of the UK's.
The final row tells us that in 2013-14, 9.2% of UK expenditure went on Scotland. In other words, more money is spent per head in Scotland than in the rest of the UK. This is another way of stating some figures in Table E.4 of GERS that made headlines, such as the Scotsman's Scots public spending £1200 per head more than UK. There are a few reasons for this.
Firstly, Scotland needs more funding to maintain the same level of public services given its low population density and many islands. If you run your eye down the table to the Transport row, you can verify one fact that's consistent with this: nearly 15% of the UK's transport expenditure is in Scotland.
Secondly, Scotland needs higher expenditure because it suffers more socio-economic problems than the UK as a whole (but not, say, compared to northern England or Wales). The "socio" bit is evidenced by Social protection and Health being above Scotland's 8.3% population share at 8.9% each. Support for business on the "economic" bit is much higher with 19.9% - a fifth - of the UK's spend on Enterprise and economic development taking place in Scotland. The other high percentage in the pink column is also business-oriented being for Agriculture, forestry and fisheries at 17.5%.
The only area of Scottish expenditure below the UK level is Science and technology at 7.5%, though this is the second smallest expenditure area in this list.
Education
It is of course not an accident that international services, debt interest and defence, all sit exactly at 8.3%; they are all UK-wide and apportioned to Scotland in GERS according to population.
However, it is surprising that Education and training sits at 8.3%, because it is devolved to Scotland. If you look over to the purple columns you can check the values for the last two 5 year periods. The proportion of UK expenditure on Education and training in Scotland was 9.4% in 2005-2009, but dropped to 8.6% in 2010-14.
The graph below shows the expenditure on Educating and training for all years of the Scottish Parliament. Health, which is also devolved to Holyrood, is shown for comparison.
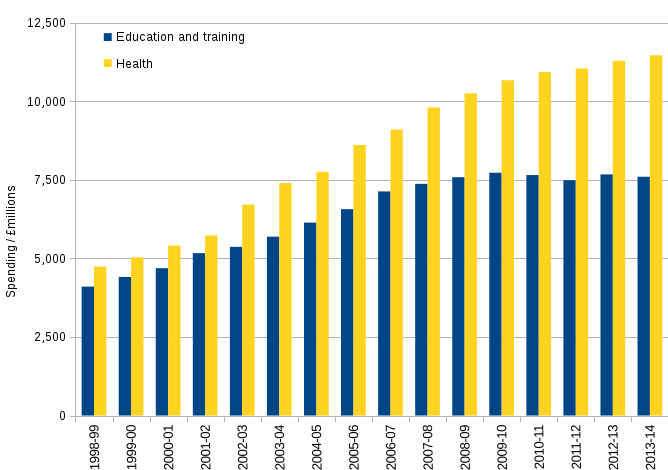
Expenditure on Education and training was rising until 2007-8, but unlike Health it stopped rising and has remained roughly constant at £7.5bn since then. As these figures are in current prices, i.e. not corrected for inflation, this means that expenditure on education has decreased in real terms in recent years. Using the CPI index of inflation, £7.5 bn in 2008 equates to about £8.7bn in 2013, i.e. this represents a cut in annual Education expenditure of £1.2bn in 2013 prices. EDIT 21/5/15: Using the ONS GDP deflator, which is more appropriate, the 2007/8 figure is £8.5bn in 2013-14 prices.
The only other significant reduction was in Science and technology, which is about 20 times smaller than Education and training. It suffered a cut in cash terms over the same time period from £350mn to £330mn, which is a real terms cut of 21%.
Change?
There's a curious trend, or rather, lack of trend in the above table. if you run your eye down the change columns for Scotland (yellow) and the UK (green), you'll notice that changes in expenditure of the country totals have been very small - almost all are less than one percentage point between the two 5 year periods.
This suggests to me that expenditure is determined by need rather than by political policy. Whereas there has been significant political change in Scotland and the UK governments during the last decade, it can be argued that needs of the people have largely not changed. The increase in Social protection does of course represent a change in need - the need of the unemployed in the aftermath of the 2008 crisis - but it too fits the idea that expenditure is need-driven. The one area that does not fit with this is the real terms reduction in Education expenditure in Scotland, but there is no way to determine the reason for this from GERS data alone.
Bottom line
Scotland receives 9.2% of the UK's expenditure whilst it has 8.3% of the UK's population, or, equivalently, public expenditure per citizen in Scotland is £1200 higher than the expenditure per UK citizen.
Almost all areas of the public sector are better funded in Scotland than for the UK as a whole. The big exception to this is the expenditure on Education and training - the third largest area - which has a received a real term cut of about 14% in its annual expenditure.
As I said in my previous post, I'll hold back on political comment until the last post on this series.