This is a just a quick follow up to my last post to tighten up a few details on the estimates I made. The numbers and graphs presented in this post supersede the ones in the last one for a few reasons which I'll detail below. But, in short, the estimate of non-wind renewables has been refined and this has resulted in less wind power being required by 2023 to meet the Scottish Government's renewable target.
New graphs
The graph below replaces the one in the last post.
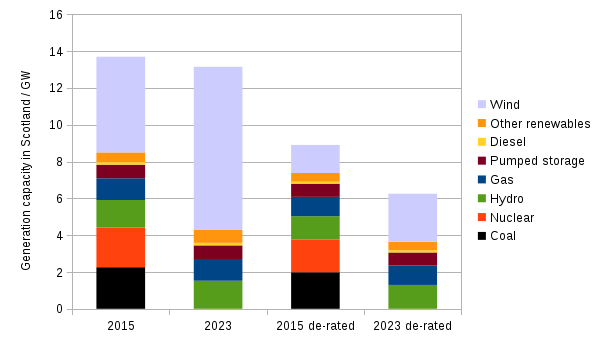
The 2015 column is little changed, except that non-wind renewables have increased by 0.6 GW, and wind reduced by a similar amount. Whereas the 2023 column was noticeably larger than the 2015 one in the last post, it is now slightly smaller having been reduced by 3 GW (as explained below).
The two de-rated columns weren't included in the last post — they show the average generation we can expect in reality. The 2023 de-rated column is much smaller than the 2015 one because of the loss of coal and nuclear, but also because de-rating significantly reduces wind capacity. As such the 2023 total de-rated capacity is much less than the 2015 value.
The next graph is new and illustrates what was described only in words in the last post. A factor of 0.85 (representing transmission losses and generators' own use) is applied to all the de-rated values in the above graph. This allows us to compare available supply with the average and peak demand values — 3.7 GW and 5.5 GW respectively.
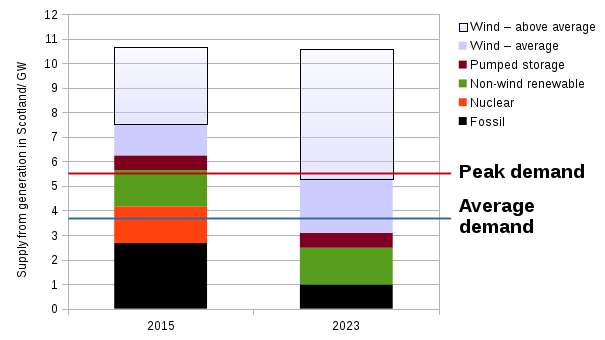
In addition to the average wind power, the possible above average amount is shown as the outlined box at the top of the columns. So on any given day, the available supply to meet demand can vary from just above the top of the brown pumped storage segment (calm day) to the very top of the outlined box (windy day).
This graph makes it clear that average and peak demand can always be comfortably met in 2015 with room to spare for exports. However, in 2023, a peak demand at average or low wind levels would require imports. In fact, even average demand might not be met on very low wind days. Exporting in 2023 would only be possible when the wind was above average.
So although some of the figures have changed quite substantially, notably the required wind capacity, the conclusion and bottom line figures remain much the same.
Note: As explained in the last post, if Scottish supply fails to meet Scottish demand that will not cause a "lights out" situation as long as demand is met across the entire GB grid.
New details
The method and so figures have changed for the following reasons:
- I improved the reconciliation of DUKES with EIS renewable figures and brought the latter up to date with data from Figure 2 in the Renewables routemap update 2015. This meant that the amount of non-wind renewables is upped by about 0.6 GW.
- Table 1 in the renewables update report states planned renewable capacity, so the 2023 prediction now assumes 30% is constructed, whereas before this value was assumed to be 0% for non-wind renewables. Since 95% of planned new capacity is wind, this doesn't have much impact.
- National Grid de-rating factors for various energy generation methods are now used: Table 8 in the National Grid EMR electricity capacity report. These multiply on to the maximum capacities and reduce them to values you might expect in reality. They range from 85% for diesel up to 97% for pumped storage, and I used a value for wind of 29.4% estimated using Scottish historical data. This is an improvement in assuming 90% for all non-wind sources (stated as a 10% decrease in the last post).
- Finally, armed with 1-3, I refined the calculation of the wind capacity so that it now just meets the 100% renewable 2020 target (before the target was slightly exceeded).
The end result of all this is that about 3 GW less wind power is needed in 2023. The most part of this comes from including more non-wind renewables because at a capacity factor of around 90%, as compared to 30% for wind, 0.6 GW of non-wind capacity equates to about 1.8 GW of wind capacity.
The full workings behind all of the above are in this spreadsheet: ods or xls formats. Please do get in touch if you find any mistakes in it.
Other things
There are a few factors worth considering not accounted for in the above:
- During a long, low-wind spell with high demand, it may happen that the stored energy in pumped storage runs lows, in which case about 0.7 GW of supply wouldn't be there to meet demand. It's also possible that low rainfall restricts hydro power as happened in 2010, which might be a particular problem due to a correlation of wind and rainfall on longer timescales.
- Non-wind renewable figures used above include about 0.2 GW of solar power. At Scotland's latitudes this would be reduced to near zero in winter which of course is when demand is highest.
- The capacity of wind turbines declines with age.
- The renewables target is based on 100% 2013 gross consumption. If gross consumption falls as it has done in recent years it may well be somewhat lower in 2020. However, the gradual decline in energy use may halt or even reverse as efficiency improvements reach a limit and population increases. The National Grid's Future Energy Scenarios predicts UK electricity consumption in 2030 to be larger than now in all four of its scenarios.
- Finally, what if the 100% renewables target isn't met, or what if it is exceeded because more than 30% of renewable projects are constructed by 2023? You can answer that for yourself by tweaking the the values highlighted in yellow in the spreadsheet mentioned above.