I've written about pre-election polling quite a lot in the last year and although I promised not to blog about politics for a while, because I've had enough of misleading and inconsistent nonsense from politicians and parties such as... sorry, let me take my anti-rantimine pill... ah, that's better, let me start again.
Polling the voting intentions of a population is vulnerable to many kinds of uncertainty, but one fundamental one you cannot avoid is sampling uncertainty. For a poll of 1000 people, it's commonly stated that the uncertainty involved on the percentages will be ±3%. I'll explain where this comes from, what it means and why it's not always valid. But let's enter into the subject with a simpler example.
Coin tosses
If you toss a coin you can expect an equal chance of it being heads or tails, i.e. the probability of each is a half. So if you toss a coin four times you'd expect, on average, to get two heads or two tails.
Let me pose a question:
If you were to place a bet on the outcome of four coin tosses, should you bet for or against there being two heads?
Most people would say for, but let's work it out properly.
Statistics says that for repeated random outcomes that are independent of each other, you can multiply probabilities to calculate the probability of all outcomes occurring. Since the result of one coin toss does not effect the next coin toss, the probability of getting two heads in a row is a half times a half, or a quarter. So for four tosses, the probability of getting four heads is 1/16. And the probability of getting four tails is also 1/16. In fact, the probability of getting any specified sequence of four tosses, e.g. heads tails tails heads or HTTH for short, is also 1 in 16.
But how can this be? Didn't we say above that getting two heads was more likely? We did, but we said nothing about the order of the results. To calculate the probability of getting two heads, we need to work out all the possible ways that can occur. All the orderings are shown below:
HHTT TTHH HTHT THTH HTTH THHT
There are six ways to get two heads, so the probability is 6/16=3/8. Similarly, we can work out all the ways to get three heads:
HHHT HHTH HTHH THHH
so the probability of getting three heads is 4/16=1/4. And in the same way we can list the probability of getting three tails:
TTTH TTHT THTT HTTT
which, unsurprisingly, also has probability 4/16=1/4. So, to summarise
| Result | Permutations | Probability |
|---|---|---|
| 4 Heads | 1 | 1/16 |
| 3 Heads | 4 | 4/16=1/4 |
| 2 Heads | 6 | 6/16=3/8 |
| 1 Heads | 4 | 4/16=1/4 |
| 0 Heads | 1 | 1/16 |
Notice that the probabilities add up to 1, which reassures us that we've listed all 16 outcomes. Also, the result of two heads (which is the same as two tails) is the most probable line in the table with a probability of 3/8. This accords with what we thought above. But - and this may be a surprise - the probability of not getting two Heads is in fact greater at 5/8.
So, to the betting question above, the answer is that it's better to bet against the outcome being two heads.
Who gives a toss?
It turns out that the probabilities of coin tossing are described by what's known as the binomial distribution. This allows us to calculate probabilities for any number of coin tosses. The graph below shows the distribution for 100 coin tosses. Notice that the probability of getting exactly 50 Heads is only 0.08 - less than 1 in 10.
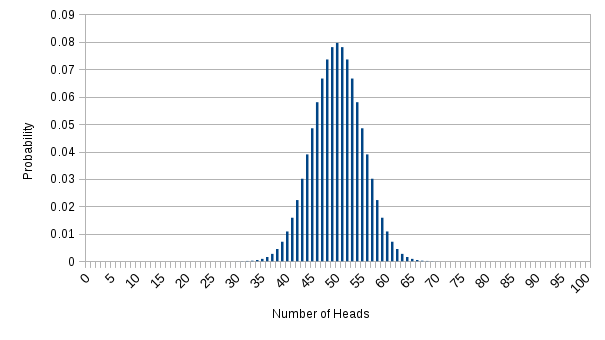
At large numbers of tosses we can start looking at confidence intervals. For example, by adding up the probabilities of getting from 40 heads to 60 heads, we can state that there's a 0.97 probability of getting a result within that range. If we go up to 1000 tosses then we find that there's a 0.97 probability of getting heads in the range 470 to 530.
Polling
So let's return to polling and imagine 1000 people are contacted out of a much larger population and asked if they supported the blue party or the red party. Let's suppose that people in the population are actually evenly split between these two parties. Then selecting a person at random is much like tossing a coin - there's a 0.5 probability they'll be for the blue party and 0.5 probability they'll be for the red party. And the results of sampling them will be governed by the binomial distribution.
In a sample of 1000, there's a 0.97 probability of finding the number of blue party supporters to be between 470 and 530 (and likewise for the red party). In percentages, this means blue party support is likely to be between 47.0% and 53.0%. This is the origin of the well-known ±3% sampling uncertainty.
Rule of thumb
The 47-53% interval is called a 97% confidence interval because if we were to conduct 100 such polls we'd expect 97 of them to come up with a value in this range. If we increase the sample to 10,000 - a factor of 10 larger - then then confidence interval narrows by a factor of the square root of 10, which is 3.2, which gives 97% confidence interval of ±1%. Likewise, if we reduce the sample to 100, then we increase the interval by 3.2, which makes it about ±10%, just as we saw above with the coin toss, i.e. 50±10%.
So the rule of thumb to estimate the size of the 97% confidence interval is this: divide the sample size by one thousand, take the square root and divide 3% by the result.
Bias
If two polls conducted over the same time period, each with sample 1000, put the blue party on 51% and 49%, then I'd have no trouble in saying they agreed to within sampling uncertainty. However, if the results were 53% and 47% then I would be confident (about 97% confident, in fact) that they disagreed with each other. In this case I'd be investigating both polls for sources of bias.
Biases occur when there's some effect that will cause you to overestimate support for one of the parties. So, for example, a survey that phrases a question in a way that favours the blue party, say
Prof McClever's study shows that 99% of red supporters are cretins. Do you intend to vote blue?
will likely show a bias that overestimates blue's percentage. Another source of bias is in failing to ensure your sample is representative of the population, e.g. by picking a geographical region to survey where the blue party is disproportionately supported.
There's no way to avoid sampling uncertainty for a given sample size, but a good pollster will do everything they can to avoid bias creeping in. In fact, that's very nearly the definition of their job.
An asymmetric, multi-party state
It's probably occurred to you that most polls don't just involve two parties that are equally popular. It turns out that the binomial distribution can easily handle the case where probabilities are not 0.5. If the probability of finding a supporter of the blue party is \(p\) then it follows that the probability of finding a red party supporter is \(1-p\). It turns out we need to multiply the width of the confidence interval by the square root of \(4p(1-p)\) (though there's no easy way to show why without getting into some mathematics relating to the variance of the distribution).
Let's suppose \(p=0.7\). This means we expect the larger party to poll 70% of the vote and smaller party 30% and
and the square root of 0.84 is 0.92. In other words, the confidence interval only narrows slightly, so ±3% is still a reasonable estimate. Even for p=0.9, i.e. one party polling 90% of the vote, the confidence interval reduces to about ±2%. But notice one implication of this: ±2% may be small compared to 90%, but it's relatively large compared to 10%.
The next question is how we deal with more than two parties. Can we appeal to a trinomial or quadranomial distribution? The answer, I think, is yes, but I'm not quite clear on the details. I understand that most of the above results are still applicable but I've yet to convince myself of that directly from the mathematics.
Want to know more?
If you want to get stuck into the mathematics of the binomial distribution then take a look at the wikipedia page. You can also find binomial calculators on the web like this one. You can have a look at the examples for 4 and 100 coin tosses I mentioned above by downloading a spreadsheet, either in ods format or xls format.