Poll companies are finding the Scottish referendum to be a real challenge. It's unlike any general election: there are only two options (yes and no) and the turnout is expected to be high, perhaps 90%, compared to 50% for the 2011 Scottish elections and 65% for the UK elections in 2010.
My previous posts explain why I will be voting against independence; this post is about my analysis of the polls. Can I be trusted not to produce a biased analysis? That's for you to judge, all I can say is that I want to be as honest with the data as possible and that if any bias does slip through it will be subconscious.
A few notes on conventions. I use % to mean an actual percentage and pp if I mean a change in a percentage (percentage points). For example, I might say that "the undecided voters went from 23% to 20%, a drop of 3 pp". All percentages I quote will be poll results for Yes, No and DK (Don't know). In some circumstances it's better to exclude Don't knows, but as they're an interesting part of interpreting the data, I prefer to keep them separate.
The data I'm working with was from a CSV download from the whatscotlandthinks.org site on the evening of Saturday 13 September 2014. I have also examined the published tables of all pollsters directly, which are available as PDFs from their websites. Only polls with tables published at time of writing are considered in this post. All polls I refer to were conducted according to the guidelines of the British Polling Council and had approximately 1000 respondents (ranging from 927 to 1268).
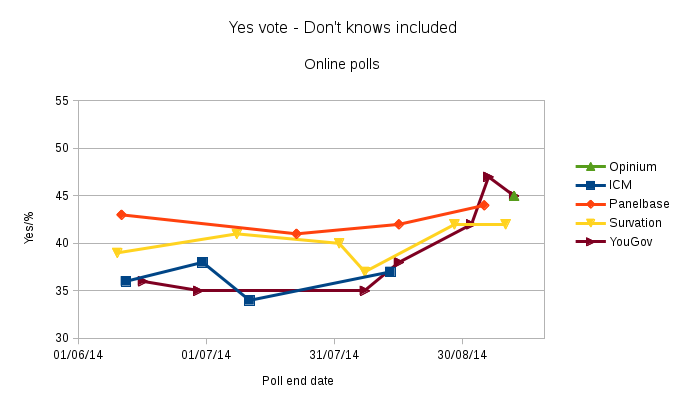
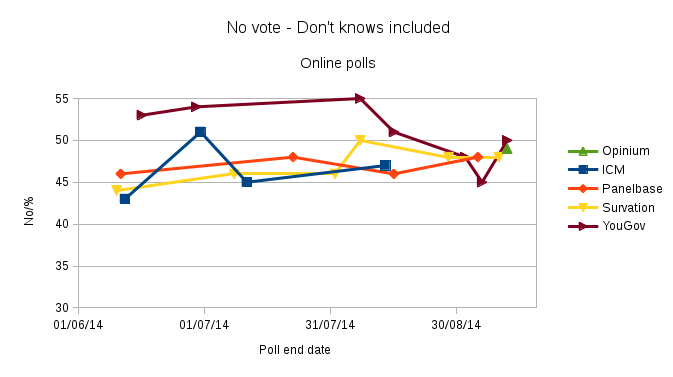
The graphs below show the time series evolution from the start of June until 12th Sept. On the left are the time series of the Yes votes for each company (click a graph to enlarge) and on the right are the time series of the No votes. Don't knows are "included", in the sense that the Yes vote for a given poll plus its corresponding No vote will add to less than 100%, the remainder being the Don't knows. The top two graphs are for online polls and the lower two are for the others. I've separated them because, as I'll discuss below, their approaches to polling are fundamentally different.
 |
 |
 |
 |
Looking at the left graphs, you can see that two pollsters - Survation and Panelbase - put the Yes vote consistently higher than the others - YouGov, TNS-BMRB, Ipsos Mori and ICM. To put some numbers on it, for the months June, July and August 2014, Survation did five polls showing a No lead at 5-6pp (5 to 6 percentage points) and Panelbase's three polls put it at 3-7pp. In contrast, YouGov did four polls in these months and put the No lead at 13-20pp; TNS-BMRB did three polls putting it at 9-14pp; ICM's four polls put it at 7-14pp; and Ipsos Mori's two polls put the No lead at 14pp and 18pp.
This didn't go unnoticed, in fact the president of YouGov Peter Kellner wrote about it on YouGov's blog and in the Times newspaper, and even commissioned a poll to try and show why Survation's method was flawed. Survation wrote this rebuttal. Given that I wanted to believe a high Yes vote was indeed wrong, I hoped to find Kellner's case was the more convincing. I didn't. Survation's response was well-argued, and Kellner's argument relied on using unpublished, proprietary data used to perform weighting, so I couldn't check his findings. Also, Kellner's criticism of a rival pollster in this fashion was quite unprecedented. Bottom line: it remained a mystery why Survation and Panelbase kept putting the Yes vote high. See John Curtice's post for more details on this story.
Panelbase and Survation polls in June to August were all conducted online, but this doesn't offer an obvious explanation because so were the YouGov and ICM polls. Ipsos Mori used the telephone and TNS-BMRB interviewed people in-person in their homes. It's certainly the case that the ordering and wording of questions can influence a poll's result, and that criticism has been levelled at Panelbase, but not as far as I am aware at Survation.
In early September 2014 there was a change. The top left graph shows that YouGov's Yes vote had risen. Soon after TNS-BMRB released a poll also showing a rise in the Yes vote. But, the disagreement between the pollsters persisted - both Panelbase and Survation polls showed no change from before, i.e. No leads of 4pp and 5pp respectively. Also, a look at the No vote graphs (right) show no decline in the No vote, other than for YouGov, which also showed the biggest rise in Yes. This leads to me to think that there was a real increase in the reported Yes vote, but for some reason this was exaggerated in the YouGov polls.
An acknowledged problem with online polls is that they have to draw results from a recruited 'panel'. These are people who agree to take part in future polling, usually in return for a small payment each time. As you might expect this will lead to a bias in demographics, e.g. biasing against folk who do not like to use the internet (older folk), and also biasing towards people who like to take part in polls (political activists). Some of these biases can be corrected by keeping detailed profiles of panel members and by weighting poll results to known population data, e.g. ONS census data. For example, if a poll finds there to be 400 women and 600 men responding, then the answers given by each woman will be weighted up. The best online polls are those where little weighting is required, but even then there are almost certainly other factors that cannot be weighted away, e.g. that people motivated to join online panels are probably more likely to have firmly held views.
One explanation of the disagreement across polls is that Panelbase and Survation's panel was from the outset a population with a disproportionate number of people who had made up their minds on how they intended to vote. So as we near the day of the actual referendum what we see is that their more settled panels produce polls with unchanging results. If so, the other polls appear more volatile because they contain people who hadn't thought about it much until recently and who started the process of making up their minds in early Sept, and moving between Yes-Don't know-No, with a preference for the Yes direction. Two non-online polls are consistent with this explanation, showing high levels of Don't knows - TNS-BMRB at 23% and ICM at 17%.
But this explanation is not satisfactory by itself. For one thing, why does YouGov, an online poll, not have such a settled panel too? Some volatility may be attributed to the fact that The Sun and The Times have been commissioning YouGov polls much more frequently of late: three polls from June to Mid-August, then four in as many weeks thereafter.
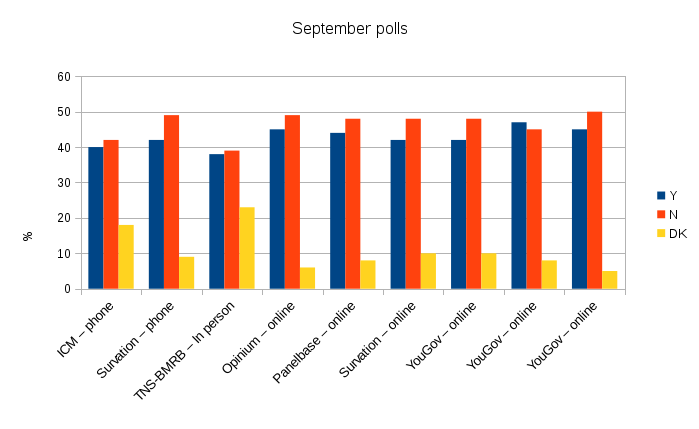
Let's turn our attention from the time series and look only at September polls, shown in the graph below. Online polls are all on the right so we can more easily compare like with like. All but one poll shows a lead for No, and the lead varies from 1-7pp. It's clear that the online polls are all now in good agreement, certainly to within statistical uncertainties. A poll's percentage has a 95% probability of being correct to within +/-3% based on the statistics of sampling; though this, of course, doesn't address other uncertainties and biases.
Martin Boon, director of ICM noted on BBC Radio 4's More or Less (12th Sept, around 6 minutes in - download here) that some people are shy to give answers to certain questions, even in the apparent privacy of a poll interview. This effect is known as the 'spiral of silence'. He suggested that there is shyness to say No because it might feel "unpatriotic". For UK general elections after 1992, when ICM first discovered the effect, they would attempt to correct it by returning some Don't knows back to what they voted for in the previous election. This cannot be done for the Scottish referendum because it has no precedent.
So, is there any evidence for the spiral of silence here? TNS-BMRB and ICM stand apart from the online polls in that their No leads are smaller - 1pp and 2pp. Both show a high level of Don't Knows compared to the online polls. For ICM the Don't Knows have increased since their previous poll, 14% up to 17%, and for TNS-BMRB the Don't knows stayed the same at 23%. The deficit of No voters and excess Don't knows compared to the online polls is consistent with the spiral of silence. But consistency is not proof. Arguing against the spiral of silence effect, is the fact that the Yes vote is also slightly lower than all the online polls. So if there is a spiral of silence in this data, it's mixed in with a sizeable minority of voters who are genuinely undecided.
For the spiral of silence to operate, there needs to be a tendency for a class of voters to be less willing to express themselves. My firsthand experience in Glasgow and Stirling during the first half of September is that people will put up Yes stickers and posters and wear badges far more frequently than "No, thanks" ones. This is true even in affluent areas where the polls tell us there should be a greater No vote. I'd estimate the ratio of "Yes" posters, stickers and badges to "No, thanks" ones as being at least 5 to 1. I understand from others (I don't use mainstream social media) that Yes voters are also more vocal on Twitter and Facebook, and they will display Yes badges on their profiles much more frequently than No voters do. It seems clear that the circumstances are right for the spiral of silence to be in effect, depressing the No vote in polls. But again, this is not proof that it's present, merely an argument that it's plausible.
The TNS-BMRB and ICM non-online polls were followed by the Survation phone poll of 10-12 September which gave results consistent with the online polls. This is probably because Survation asked respondents how they would vote now, whereas TNS-BMRB and ICM asked how the respondent would vote on the 18th, the latter leading to more Don't knows.
There's also direct evidence in recent polls that many people have made up their minds. For example, Opinium's poll tells us that over 90% of people saying 'Yes' or 'No' are highly unlikely to change their mind.
There's also the question of what the 50% who didn't vote in the last Holyrood election in 2011 will do in the referendum. Many polls on the referendum ask people how they voted in the 2011 election, and this was examined by John Curtice's blog post on the so-called "missing million"; his conclusion was that they were more likely to vote No. The last TNS-BMRB poll weakly agrees with this too: second questioning of "Don't know"s yielded a preference in favour of No of about 4:3, though the majority of Don't knows said 'Don't know' even at that second question.
Taking all the above into consideration I'm inclined to believe that the No lead is small but real and if anything underestimated. It's still possible for Yes to win, but I think it unlikely.
EDIT 15 Sept 2014: after I wrote this post, I found this piece by Stephen Fisher which makes many of the same points, and also looks back at other comparable votes.