I've updated the analysis I performed at the weekend to include the five polls released since then: ICM for The Sunday Telegraph; ICM for The Scotsman; Panelbase for The Sunday Times; Opinium for The Daily Telegraph; and Survation for The Daily Mail. All of these were online polls.
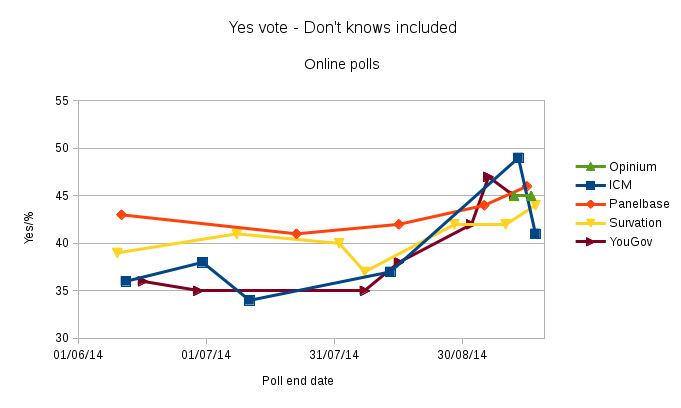
Here are the updated graphs for these new online polls:
 |
 |
And here are all the September polls. Note that the polls in each group are ordered in time, so that, for example, the rightmost 'Survation - online' poll is the most recent one.

Very little has changed, except there is now good agreement across polls. The obvious exception to this is the ICM online poll for The Sunday Telegraph which stands out as giving Yes a significant lead - a first in this campaign. However, it has an unusually small sample size compared to others and was conducted quite differently - see John Curtice's blog post for more on this poll where he also explains why it receives a weighting of 0.7 in his Poll of Polls. The other change is that there is evidence of a slight boost to the Yes vote, but at 1%, it's less than statistical sampling uncertainties involved.
The No lead (including Don't knows) averaged across the fourteen September polls (applying a 0.7 weighting to ICM Sunday Telegraph Poll) is 2.9pp. Is this statistically significant? The binomial distribution tells us that if we are looking at a sample of 1000 people where there's an equal chance of getting a Yes or a No, then we can expect that 95% of samples will fall in the range 47% to 53%. This is the basis of the +/-3pp uncertainty, and why it is stated as being for 95% confidence. If we take N samples of 1000 people and average the results, as I have done here, then the uncertainty is reduced by the square root of N. Therefore we can say the No lead is 2.9pp +/-0.8pp. If we restrict the average to the most recent poll for each pollster, and for each type (i.e. so we included two polls for Survation and ICM each, as they've recently done phone and online polls), then the No lead averaged over those 7 polls is 3.9pp+/-1.1pp.
Although these No leads are statistically significant, no account is taken of anything but statistical sampling uncertainty. Most crucially, there's no bias being accounted for here, other than whatever is being corrected for in the weightings of the various polls. In my previous post I devoted most attention to the Spiral of silence bias in the No direction, but here I want to see if there is any evidence of a bias in the Yes direction arising from failure to weight properly by social class. The more affluent class is ABC1 and poorer one is C2DE. To investigate this I've looked through the tables of 5 recent online and phone polls to see what biases might be left over from the weighting.
There's actually quite a lot of weighting performed in the polls, and mostly it has the effect of raising the Yes vote relative to the No vote. Generally, this is because more affluent people are responding to the polls (i.e. there is more of social class ABC1 than C2DE), but the effect of this seems to be properly corrected for in the weighting. The only exception to this was the Survation phone poll for which no weighting by social class was performed explicitly, but in that case it's plausible that heavier down-weighting in other categories, e.g. Conservative voters, at least partially addressed the problem.
The recurring feature that I noticed is that although the voting recall of the 2011 Scottish elections is correctly weighted by party, this is not true for the group of people that did not vote in this election. This is precisely the problem that John Curtice addressed in his blog post on the missing million. For the five recent polls, I've peformed a similar analysis. The table below shows the results.
| End date | Pollster | Total | DNV | Y | N | DK | Reference |
|---|---|---|---|---|---|---|---|
| 16/09/14 | Survation - online | 885 | 20% | 61 | 93 | 23 | Table 21, p24 |
| 16/09/14 | ICM - online | 964 | 22% | 60 | 94 | 57 | Table 3, p6 |
| 15/09/14 | Opinium - online | 1156 | 16% | 67 | 87 | 36 | Q3, p11 |
| 12/09/14 | Survation - phone | 893 | 24% | 83 | 106 | 29 | Table 4, p6 |
| 11/09/14 | ICM - phone | 803 | 15% | 46 | 51 | 23 | Table 3, p6 |
The Total column gives the total number of respondents that were included in producing the headline Yes, No, and DK figures, often reduced below the total number of respondents because of turnout weighting (i.e. don't include people who might not vote). DNV is the percentage of that total that said they did not vote in 2011 (unlike John Curtice I didn't include those who couldn't remember). Then Y, N, DK give the Yes, No and DK numbers (not percentages!) for referendum voting intention. Note that Y+N+DK divided by Total is equal to DNV. The Reference column tells you where to find these numbers in the PDF downloads from the pollster's website. I did try to include Panelbase's most recent poll in this study, but the pages in its PDF were truncated so data was missing for the DNVs.
What's immediately striking is that whilst 50% of people did not vote in the 2011 election, this table tells us that only between 15% and 24% of poll respondents say they did not vote. It should be noted that DNV is the value after weighting - the unweighted values were significantly lower in some cases.
The second feature is that the No vote is consistently stronger amongst the DNVs in all cases, being about 3:2 in favour of No in Survation and ICM's online polls. The two phone polls show smaller differences though. So, as John Curtice found in previous polls, people who did not vote in 2011 seem more likely to vote No. If we were to weight poll results so that DNV was 50% then the No lead would be increased by a pp or more for all but the ICM - phone poll.
The 'Missing million' issue was originally phrased as being due to less well off voters, but who are the DNVs? To see if the DNVs reflected any particular class, I looked closely at the results for Survation's Daily Mail poll. Its DNVs were 2:1 female, less likely to be 65+, not obviously from any particular part of Scotland, and almost as likely to be in social group ABC1 as in C2DE. In short, these DNVs with a preference for No seem to be mostly woman under 65.
Of course, if there's a class of people that are completely hidden from the polls, then there's a bias we won't know about until the result is announced on Friday morning.