Scotland's fiscal flows are the monies related to tax and public spending that wend their way through all three levels of government — UK, Scottish and local — and sustain our public infrastructure and services.
I created the diagram below to illustrate the flows, drawing on a number of sources. The figures relate to 2015-16 and should be regarded as estimates as we're still in that financial year. They're rounded to the nearest half billion pounds, though the uncertainty in my estimates may well be a bit higher for the larger figures. Numerical details and full references to sources are in this spreadsheet available in ods or xlsx format.
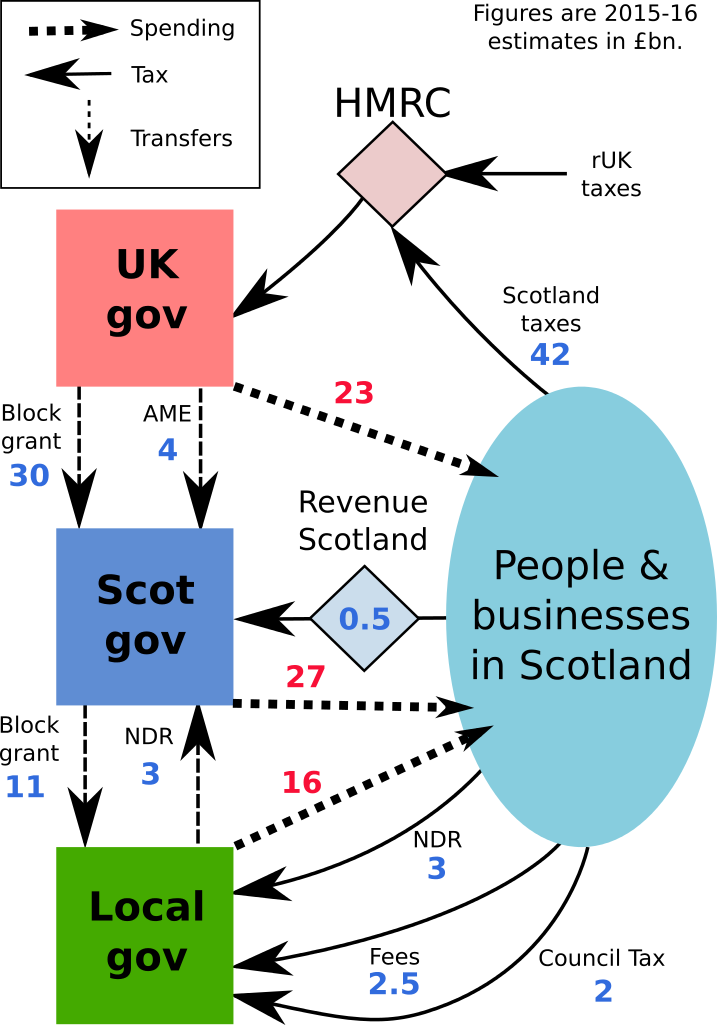
The main part of the diagram is the oval that represents Scotland's people, its businesses and the public infrastructure and services that allow them to live their lives and do their work. As they work they will pay income tax, national insurance, VAT, corporation tax and so on. This is collected along with all UK taxes by HMRC.
Next, look to the UK government box. From it are two transfers going down to the Scottish Government: the block grant of £30 billion and the AME component of £4 billion. The block grant is set according to Departmental Expenditure Limits (DELs) that represent more predictable costs which can be agreed on at spending reviews that occur every few years. In contrast, AME (Annually Managed Expenditure) is demand-led funding that must be determined each year. The Scottish Government also receives £0.5 billion via Revenue Scotland from the new taxes it started levying from April 2015. These are the landfill tax and LBTT which replaced stamp duty on property and land sales.
Local government's major source of funding is the £11 billion block grant from the Scottish Government. This is supplemented by £2 billion raised from council tax and £2.5 billion of fees from various council services.
Just as local government collects council tax from residents who live in homes, it collects a tax from businesses called non-domestic rates (NDR). The £3 billion of collected NDR monies is transferred to the Scottish Government who then redistribute it back to the councils (included in the block grant in this diagram). This is done because there is significant variation of the NDR raised from one council to the next.
The spending by each level of government is shown by the dotted arrows. The Scottish Government spends the most at £27 billion. This is dominantly on health, with the rest divided between pensions, education (universities and colleges), infrastructure and justice. The UK government spends £23 billion, and this is almost entirely on pensions, welfare payments and defence. Finally, local government spends £16 billion, with most of this going on school education, social work and housing.
We can now summarise how tax and spend balances overall:
| £ billion 2015-16 | Tax | Spend |
|---|---|---|
| UK Government | 42 | 23 |
| Scottish Government | 3.5 | 27 |
| Local Government | 4.5 | 16 |
| Total | 50 | 66 |
Note 24/2/16: When this post was first published the tax figures in the above table were incorrect and the 42 which appears in the diagram was wrongly shown as 38. The same figures have also been corrected in the spreadsheet. Thanks to @McCaigsTower for bringing it to my attention.
It's clear that tax does not come close to equaling spending at any level, and that £16 billion more is spent in Scotland than is raised in tax. This is sometimes referred to as the net fiscal balance (closely related to, but not quite the same thing as the deficit).
The first line of the table appears to show the UK government collecting much more tax from Scotland than it spends. This isn't the UK government screwing over Scotland, or the mystical whisky export duty or such-like, it's just that this table is a summary of tax and spending only. A glance back at the diagram above shows that £34 billion is transferred to the Scottish Government and it in turn transfers £11 billion of that to local government. In this way, the block grants and other transfers ensure that Scotland has the funds needed for its spending at all levels irrespective of what tax revenue is raised.
By law, the Scottish Government has to balance its books each year. In recent years it underspent its budget, but it now has some borrowing powers and can draw on reserves, so has a little more fiscal wiggle room. Local government too can borrow money, but in both cases the amounts borrowed for 2015-16 are small and lost in the rounding in the diagram above.
It'd take a giant illegal wiggle to square off the missing £16 billion if it were to appear in the Scottish budget reconciliation, and thankfully it isn't necessary because it gets swallowed into the UK's overall budget deficit.
Deficits are not necessarily a problem for states like the UK which have their own central bank and currency. In fact, the UK has run a deficit in 54 of the 60 years between 1956 and 2016 and, if you care to count them, you'll probably find that Conservative governments have run more years with deficits than Labour governments.
But I digress. The reason I wanted to test my understanding by creating this diagram is that mother SNP and father Tory have, after much huffing and puffing become the proud parents of a newly born fiscal framework. Amongst other things, this provides the new rules for calculating the block grant to the Scottish government given the tax powers that will arrive once the Scotland Bill comes into effect. I'm not sure what the outcome of all this will be, but my next task is to create an animated version of the diagram in which the arrows move around Dad's Army-style.