In the wake of Scotland voting to remain part of the UK, the SNP government has proposed Full fiscal autonomy (FFA). This means expenditure will need to be met by tax revenues raised in Scotland, and the shortfall, i.e. the deficit, will need to be covered by borrowing arranged by the Scottish government. Scotland would remain part of the UK and so have to pay a contribution to the Westminster government for its share of defence and other international costs. You can think of FFA as fiscal separation or fiscal independence.
Update: the SNP have released their 2015 General election manifesto and renamed it Full Fiscal Responsibility.
Although it seems unlikely that FFA will find political approval in coming years, its implications deserve some attention. In this post I'm going to use a simple model of my own devising to look at how different assumptions of growth and expenditure will affect Scotland's deficit under FFA. The model draws on historical data from Government Expenditure & Revenue Scotland 2013-14 (GERS) to establish trends for Scotland's share of UK public sector revenues and expenditure, and combines them with Office of Budget Responsibility (OBR) UK forecasts to predict them for the next five financial years.
Deficit breakdown
The graph below shows Scotland's deficit deconstructed into various components which are useful for understanding implications of FFA. The data plotted are:
- ■ blue: this is Scotland's population share of the UK deficit, i.e. in 2013-14, 8.3% of the UK's population resided in Scotland, so the blue bar for that year is 8.3% of the UK's deficit (i.e. PSNB ex).
- ■ red: this is the extra deficit peculiar to Scotland excluding North Sea revenues. Most of it comes from Scotland having a higher spending per capita, but a smaller part is due to non-north sea revenues per head being slightly lower. It is positive and so always increases Scotland's deficit.
- ■ yellow: this is Scotland's share of North Sea revenue (less the small amount already included in the blue bar). It is negative and so always reduces Scotland's deficit.
- ━ green: this is the Scottish deficit. Adding the red, blue and yellow bars together (remembering the yellow is negative) will give the green line's value for a given year.
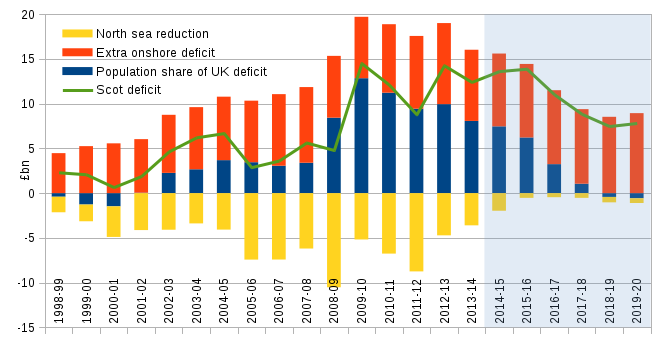
Source: A breakdown of the history of the notional Scottish deficit as generated by a simple model using data from GERS. The OBR's March 2015 Economic and fiscal outlook report for the UK is the basis for forecasts in the shaded area. As with GERS, all figures are in current prices, i.e. not corrected for inflation.
The data to the left of the shaded region is based on actual data on Scottish finances from GERS. The shaded area to the right are forecasts using my model which applies recent trends in expenditure and revenue from GERS to infer forecasts for Scotland based on OBR forecasts for the UK. Further detail on how these components are calculated can be found in an appendix at the end.
When the green line is above the top of the blue bar, Scotland is in a weaker fiscal position than the UK as a whole, and by weaker I mean that if Scotland had FFA, it would have a higher deficit per capita than the UK.
Over the last 15 years, Scotland would have been weaker in all but three years, and those years were when oil revenues were highest, i.e. the yellow bars are longest.
The red bars represent a potential extra fiscal problem for Scotland which has historically been mitigated by the yellow bars. It is only potential because neither the problem nor its mitigation have mattered in reality because Scotland's extra deficit is heavily diluted in the UK's deficit.
The word deficit is often used rather loosely, so to be precise, the Scottish deficit (green line) is the negative of the net fiscal balance as reported in GERS. It is current plus capital expenditure less revenue. GERS also states a UK net fiscal balance which is the negative of PSNB ex (Public Sector Net Borrowing Excluding temporary effects) quoted by the OBR report and ONS Public Sector Finances. Although not strictly correct, to be consistent with common usage and keep jargon at bay, I refer to this as the UK deficit in this post.
Forecasting full fiscal autonomy
If Scotland had FFA then it would have a deficit, and the deficit would be the green line. The forecasts I've produced in the shaded region of the graph show what would happen under two assumptions:
- that the OBR predictions for the UK under the current coalition government's plans are correct;
- that the tax revenue and expenditure trends that have persisted for at least the last fifteen years continue if Scotland has FFA.
Neither assumption is likely to be true, but it still makes sense to explore some possible scenarios using the above forecast as a baseline. First let's consider the big implication of the plummeting forecasts for North Sea revenue that come from assumption 1.
The graph shows that North Sea revenue (yellow) almost disappears from 2015-16 onwards. This means that there is nothing to mitigate the extra deficit (red) and consequently Scotland's deficit (green) remains well above its share of the UK deficit (blue). The size of the red bars represents the £7.6bn deficit estimated by the IFS that is dubbed the "black hole" by the media. Notice that even as the blue bars shrink, there is no reduction in the red bar. The explanation is simple: the coalition government strategies are designed only to reduce the UK deficit and so they don't address the extra deficit in Scotland.
So under FFA, Scotland would need to introduce additional measures to bring its extra deficit down. The SNP government claim they will do this by using the "fiscal levers" that they will gain control of under FFA.
Let's imagine an alternate reality in which FFA powers come into effect in 2014-15. If Scotland had voted to separate in 2014 then this would have happened in 2015-16, so it's not too far fetched.
There are two sets of levers to operate. A Scottish government could choose to pull back on the expenditure levers, i.e. make cuts. This is the coalition government approach for the UK. The SNP object to this, with some justification in my opinion, so they talk up the other option: to throw forward the levers that will increase revenues.
The SNP don't propose any tax rises, but instead express a belief that economic growth will result in increased revenues from income tax, VAT and corporation tax. Specifically, they say that Scotland's non-North Sea (onshore) annual revenue is predicted to grow by £15bn by 2020. This is true (give or take a billion) but it does not help in reducing the red bars, because that growth of revenue is simply reflecting the growth of UK revenues predicted by the OBR, and is already implied in the graph: it's part of the reason for the blue bars' reduction, with coalition cuts accounting for the rest.
Extra growth?
Having established that the growth predicted by the OBR cannot reduce the red bars, the question becomes how much extra growth is needed to do so? As North Sea revenues are a lost cause for the next five years, the extra growth would need to be in onshore tax revenues.
The graph below is identical to the one above, except for the forecasts: the extra deficit (red) is eroded to zero in 2019-20 by a growth in onshore revenues.
Source: As for the the previous graph, except now the models assumes a 2% growth in onshore tax revenues in Scotland.
The real (i.e. inflation adjusted) revenue growth needed to produce this forecast is about 4.6%. The OBR forecasts UK real GDP growth to average at 2.4% over the next five years, so extra growth of about 2pp (percentage points) would be needed from Scottish onshore revenues.
But this model uses OBR forecasts that assume coalition cuts are taking place. The SNP have said that they'd like Westminster to grow annual expenditure in real terms at 0.5%, so presumably, if they had FFA they might want to do that in Scotland. I found that adding 0.9pp to Scottish expenditure (remember these are nominal, i.e. not inflation adjusted) produces an annual growth in Scottish expenditure of 0.5% in real terms. To produce the above graph, i.e. bring the Scottish deficit to zero in 2019-20, requires 3pp extra onshore growth, making the real growth rate a hefty 5.6%.
One thing that's not included in the two scenarios I've mentioned is the extra burden of paying for borrowing, as that would be required to cover the deficit during the years it is being reduced. It would of course only increase the deficit and require more extra growth from revenues.
Enforced cuts?
But what if borrowing could not be secured under FFA? In this case cuts would need to be made. Let's optimistically assume that the UK agreed to use its borrowing to cover the blue share and shoulder the debt interest payments too, then Scotland would have to eliminate the remaining deficit by cutting the red bar down until it was at least as small as the yellow bar.
So the cuts for 2014-15 would be £6.2bn and for 2015-16 as £7.7bn. From 2014-15 to 2019-20, a cumulative total of £46bn of cuts would be required, and this is in addition to the coalition cuts assumed in the OBR's forecast. For context, this represents 11% of the annual Scottish expenditure, and equal to the spend on Education and training.
Bottom line
There is no prospect of growth on anything like the scale that the SNP would need to close Scotland's extra deficit. No major, developed economy has shown real growth of around 5% in recent years. In fact, the UK is currently one of the best performers with 2.6%.
The fact that an FFA Scotland has no track record of borrowing, that it embarked on FFA knowing that it would face such a large deficit and that Scotland does not have control over its own currency would all make borrowing very difficult and more expensive than for the UK. The likely outcome would be a mixture of costly borrowing and cuts over and above what the UK coalition government propose, with the full burden falling on Scotland.
The easiest way to avoid these intractable difficulties is for Scotland to reject FFA and continue the arrangement of pooling resources with the UK. That's not to say the UK has to remain as it is, nor is it a statement that Scotland is "too wee and too poor" to be independent (a phrase only uttered by the SNP). It is simply saying that for the foreseeable future FFA is both economically unwise and self-defeating in that it serves neither Scottish interests nor those of the UK.
Last minute update: At almost the moment I was about to hit publish on this post, this IFS report was published. It broadly agrees with what I've found, though it forecasts a slightly greater extra deficit for Scotland. For example, Table 1 shows an extra deficit of £49bn over the next five years, whereas I found it to be £46bn. The IFS predicts a real growth rate of 4.5% is needed to avoid this deficit by 2019-20, consistent with my estimate of 4.6% above. I'm reassured that my amateur and self-taught understanding of these things turns out to be consistent with a respected body such as the IFS
Appendix: Model details
The spreadsheet that generated the graphs and data discussed above can be downloaded from these links: download ods or download xls.
The mathematics below describe the simple model used to split Scotland's deficit figures into the components displayed on the above graph.
Let the UK deficit for a given year be \(D\) and the expenditure (Total Managed Expenditure) be \(E\) and revenue (current receipts) be \(R\). Let's also split \(R\) into the sum of onshore revnue \(O\) and north sea revenue \(N\). So, we can write the deficit as:
We can do the same for Scotland using the subscript \(s\):
Let the fraction of the UK population that live in Scotland be \(p\). We can then write the Scottish expenditure, onshore and North Sea revenues as follows:
where \(e\) is the fractional extra expenditure for Scotland above what you'd expect from it's population share, and \(o\) and \(n\) are similar but for onshore and North Sea revenues respectively.
For 2013-14, \(p=0.083\), \(p+e=0.092\), \(p+o=0.081\) and \(p+n=0.755\). Notice that \(p+o\) is less than \(p\), so \(o\) must be negative, whereas \(e\) and \(n\) are positive, as has been the case for at least the last fifteen years. In the base model shown in the first graph, the forecasts have \(p\) declining slowly at its recent historical rate of -0.24%, and \(e\), \(o\) and \(n\) remain approximately constant over the next five years.
Inserting (\ref{shares}) into (\ref{ScotDeficit}) gives:
where (\ref{UKDeficit}) is used to substitute \(D\) in after the second line. The three terms in the final line are the population share of the UK's deficit \(pD\) (blue bars); the extra deficit for Scotland \((eE-oO)\) (red bars); and reduction in deficit due to North Sea revenue (yellow bars).
Notice that because \(o\) is negative, the \(-oO\) increases deficit. Also, the \(nN\) term is not just the geographic share of North Sea revenue but the extra on top of population share. The population share of North Sea revenue is contained within \(pD\).